I wrote this blog post to help those of you who are reaching retirement age and own a lot of individual stocks in your brokerage account, and you are not sure what to do with them.
Not knowing what to do, not having a strategy, can be paralyzing and you may be unable to sell anything or move your accounts. You are likely worried about the capital gains taxes you will trigger if you sell those stocks.
People usually end up owning a lot of individual stocks in two situations. The first is a DIY investor who has bought individual stocks over the years and never sold any.
I recently met with a gentleman who listened to the Motley Fool podcast and subscribed to their newsletter for the past 20 years. When the Motley Fool service recommended a stock, he bought it. Now he is looking to retire next year, and he has a portfolio of over 100 individual stocks.
The other situation where someone might end up with lots of stocks in their brokerage account is someone with an AUM financial advisor. An AUM advisor is someone who charges a percentage of the account to manage it. They often buy and sell individual stocks to make it look like they are doing something worthy of the high fees they charge.
I talked with a woman last month who was in this situation. Her accounts are at Morgan Stanley, and she is paying her current advisor over $40,000 per year to manage her accounts. (1% of $4 million is $40,000.) She would like to move the account to Schwab and manage it herself, saving herself $40,000/year in retirement.
The list of stocks on the right is from her account. You can see she owns many of the same companies that are in the index (Apple, Amazon ,Google, etc.).
Looking at your own portfolio with all these individual stocks may stop you from taking control of your own account because it looks complicated.
Your Own Personal ETF Concept
In a brokerage account with many stocks, you have essentially created your own personal ETF. If you think about your account with many stocks as a whole, it is like an ETF where you can see all the current holdings.
What is an index fund? An index fund owns a sampling of the market that targets certain characteristics. It may be the largest 500 stocks, it may be value stocks, small-caps, or many other characteristics.
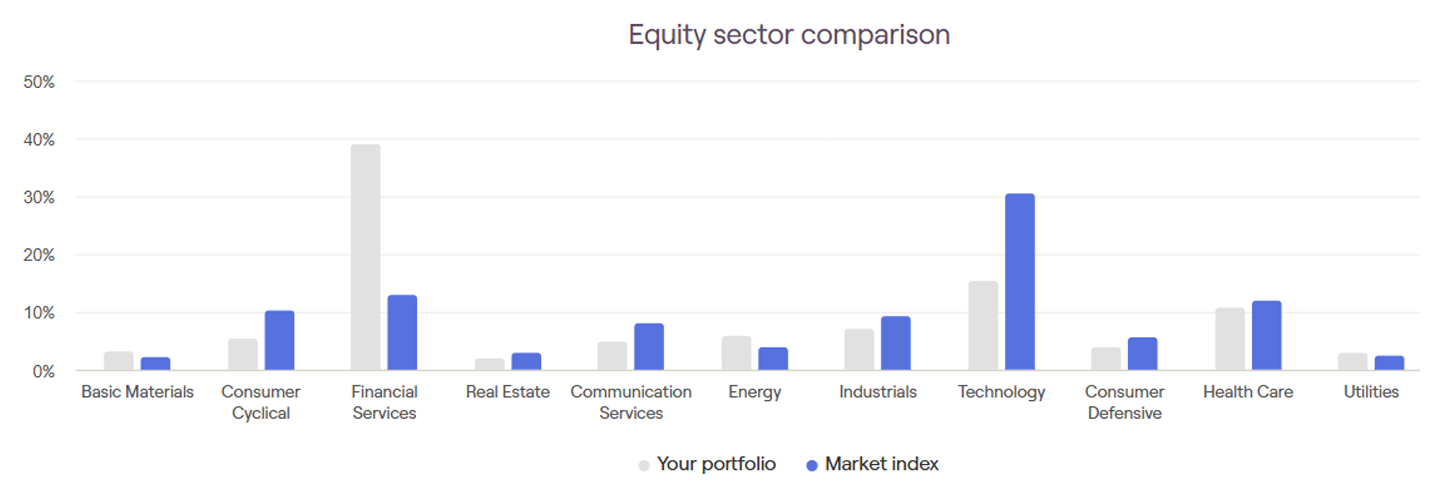
As an hourly financial planner, I have software that I can enter your holdings into, and it enables me to compare your basket of stocks to the index. The following graphic shows a client’s portfolio.
You can see he owns more bank stocks and therefore fewer tech and other stocks than the index.
Self-management In Retirement
If you want to self-manage an account like this in retirement, you do not need to actively trade this account like your financial advisor was doing.
Index funds do not trade their holdings daily. They are rebalanced quarterly. I think adjusting your holdings quarterly is not even necessary. Making a selling priority list once per year is enough.
As a retiree, you will be withdrawing from your account by selling off stocks most years. You can sell off whichever stocks will move your account towards matching the index. In other words, sell the stocks that are most out of line with the index, as needed.
The goal for my client I mentioned above would be to prioritize selling enough bank stocks to cover his living expenses in the coming years plus a bit extra to use to buy a technology ETF. That way, over time, he moves towards matching the index. Also, his portfolio gets simplified as he sells individual stocks.
He doesn’t need to sell all at once to match the index immediately because the stocks he owns are good, quality companies.
The situation of owning a long list of individual stocks is really not as complicated as it first appears.
If you are someone who owns many individual stocks, then I hope the concept of you owning your own personal ETF, will help you realize that you can manage your own account in retirement. Contact me if you would like help getting started.
This is a written summary of a video I posted on YouTube.
Introduction
Recently, I worked with a client couple who were considering using Schwab Intelligent Portfolios, a Robo-advisor, for managing their retirement funds. This got me wondering whether using a Robo-advisor or all-in-one self-rebalancing fund is indeed the best strategy for retirees, or if a more traditional approach of managing stocks and bonds separately would yield better results.
In this article, we’ll explore both these options in the context of a retirement withdrawal account and examine which one proves more beneficial.
Robo-Advisors vs. Traditional Portfolio Management
In this study I wanted to compare automatically rebalanced solutions. This includes robo-advisors and mutual funds or ETFs that rebalance automatically. Examples of such funds include target-date funds, Vanguard Life Cycle funds, balanced funds, income funds, Vanguard Wellington and Wellesley funds, and others.
What Are Robo-Advisors?
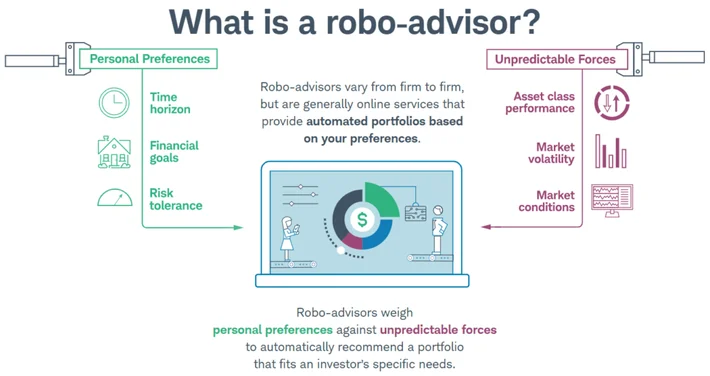
Robo-advisors like Schwab Intelligent Portfolios are automated platforms that manage your investment portfolio using algorithms. They automatically rebalance your portfolio to maintain a set asset allocation, which can relieve investors from the day-to-day management of their investments.
Traditional Portfolio Management
In contrast, traditional portfolio management involves manually balancing your investments, where you maintain separate holdings for stocks and bonds. This allows the investor to decide which assets to sell based on market conditions, giving them more control over their outcomes.
The Case Study
To determine which strategy works better for retirees, I conducted a case study using two different 5-year periods.
1999 to 2003 – this included the dot-com bubble.
2019 to 2023 – this timeframe included the COVID-19 crash and subsequent recovery, followed by the 2022 bear market.
Methodology
– The portfolio starts with $1 million. – $50,000 is withdrawn each January.
Here are the selling rules which made keeping stocks and bonds separate the better technique. – Withdraw from stocks if the previous year’s returns are positive. – Withdraw from bonds if the previous year’s returns are negative.
I used Portfolio Visualizer to determine the portfolio returns. Its new interface is somewhat confusing, so I used the Legacy User Interface to conduct my analysis.
For the traditional management account, I used:
– Vanguard Total Stock Market Fund (VTSMX) – Vanguard Total Bond Market Fund (VBMFX)
For the Robo-advisor / All-in-one setup, I assumed a fixed 60/40 stock-to-bond ratio of the two funds. I had the portfolio set to rebalance monthly to approximate the auto-rebalancing of the robo or funds.
Analysis and Results
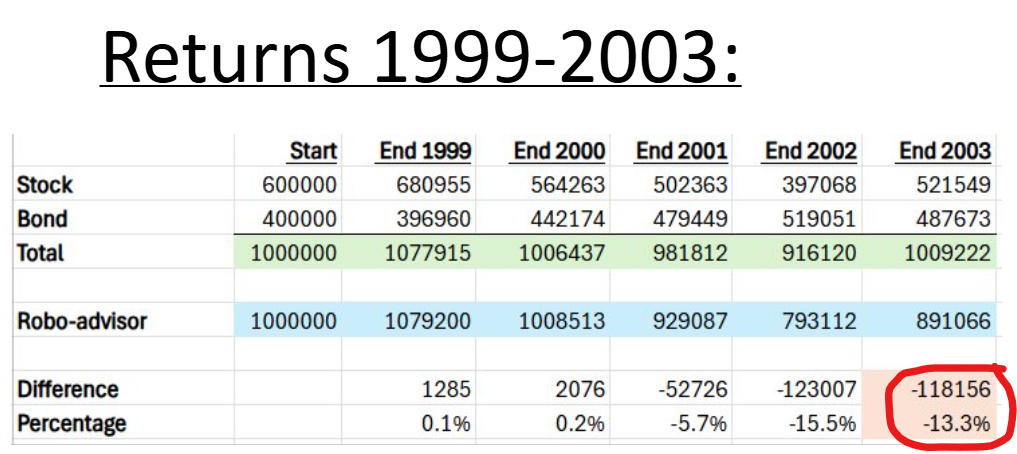
1999 to 2003 (Dot-Com Bubble)
– Withdrawals were made from stocks in 1999 and 2000. – Withdrawals from bonds in all other years.
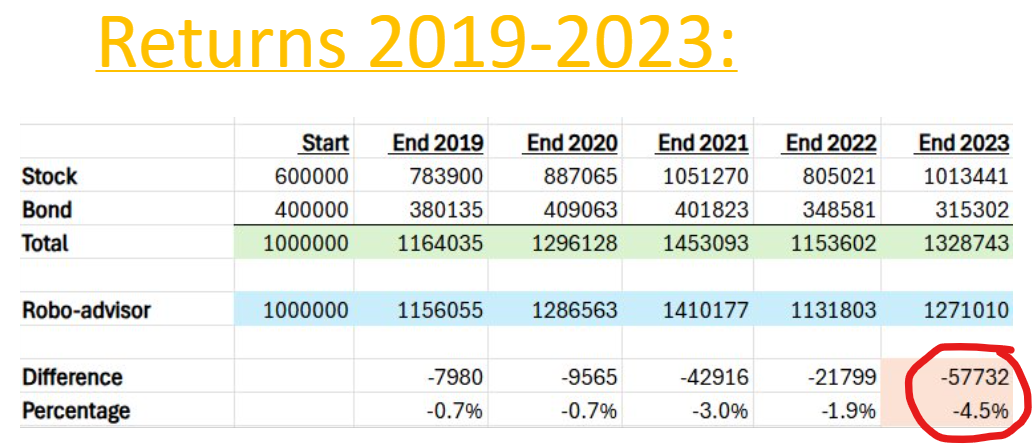
While the difference here is less pronounced compared to the first period (only a 4.5% difference), the self-managed portfolio still outperformed the Robo-advisor / All-in-one Fund. This outcome suggests that during periods of strong stock market performance, self-managing your investments can contribute to better financial outcomes, but the real advantage occurs when the market is down.
Implications for Retirees
Self-managing your investments can really pay off during times when the stock market is down. By selling bonds to generate cash in down stock market years, the stock portion can recover faster, which leads to larger portfolio balances.
I understand self-managing your investments takes some time and effort, but one option that would limit the time needed, is to self-manage your first priority withdrawal account and use an all-in-one fund or robo-advisor to manage your other accounts.
To set up a free-first meeting with Andrew please CLICK HERE.
I have had a few new clients recently tell me they do not understand bonds and therefore have not invested in them. They are currently invested in money market funds or CDs, instead of bonds. This post should explain how bonds work and why investing in them is a good idea.
Basically, a bond is an IOU. Government entities or companies issue bonds. The purchaser gives the government entity or company some money in exchange for interest payments over a set number of years into the future and once that set time is up, the issuer returns the original principal.
In order for the issuer to attract someone to buy the bond (to give them money in exchange for an IOU), they must offer an interest rate that is competitive with other investments the investor could put their money in.
When the original purchaser buys the bond, they get the interest payments at the original offered percentage. Bonds can be bought and sold after the original purchase. The original interest payment amount transfers with a bond that is purchased after the original issue.
For example, a $1,000 bond offered originally at 5% would make payments each year of $50, regardless of if the original buyer later sold it.
Now let’s say interest rates have dropped (as might be the case in 2024). The offering company or government no longer needs to offer a bond at 5% to be competitive. Let’s say they can now offer 4% and still have enough buyers that they will sell all the bonds they offer.
The new bonds cost $1,000 and pay $40 per year. The people who bought the old bonds are happy because they will continue to receive their $50 per year. But what if they wanted to sell? Is their bond worth the $1,000 they paid for it? Or more? Or less?
Well, lots of buyers would prefer to pay $1,000 for a bond that pays 5% ($50/year) than to pay the same amount for a new bond that pays 4% ($40/year).
To make the percentage payout equal, the old bond should be worth more. A bond purchased for $1,250 that pays $50 has a payout percentage of 4%. The same percentage as a new $1,000 bond that pays $40. (In reality, bond pricing is more complicated than this.)
This shows the characteristic of bonds where the price goes in the opposite direction to the interest rate. The interest rate went down from 5% to 4%, but the price or value of bonds for sale on the open market went up. To keep this idea straight in my head, I always think through the thought process of a purchaser.
Bond values are expected to increase within the next 12 months when the Federal Reserve lowers interest rates. The people who already own bonds will continue to receive larger payments and the value of their bonds will go up. Therefore, it should be a good strategy to buy bonds now, before the interest rates drop.
Bond funds
Bond funds, either mutual funds or ETFs, are a combination of a lot of bonds. Usually thousands of bonds. They are issued by different entities, mature at different times, and have different interest rates on them. The fund manager buys and sells bonds to keep the fund’s characteristics at the desired values.
The desired values include statistics such as average time to maturity, type of issuer, taxable or tax-free, duration (which measures how sensitive the bond price is to interest rate changes), and others.
Types of Bonds
Bonds are offered at various interest rates, depending on the quality of the issuer. It makes sense that the Apple Corporation can attract investors without paying as high an interest rate as a less secure company such as Bed Bath and Beyond. There is always a risk that the issuer of the bond will not be around at the end of the bond’s term. The end of the term is called maturity. When a bond matures, the person who owns the bond receives their principal back, assuming the issuer has the money to pay them back.
Due to the quality of the issuer, there are different bond ratings. Investment grade is the highest level, and below a cutoff point, bonds are considered “high yield” or “junk” bonds. The “high yield” term makes sense because these companies must offer a higher yield to entice buyers since their bonds are at a higher risk of defaulting and not paying back the principal at maturity or making the payments along the way.
I don’t think retirees should be investing in high-yield bonds. Retirees should be investing in safe bonds from highly rated issuers, including the US government, so their money is available when needed to pay for living expenses.
There are ETFs and mutual funds that have sliced up the bond market in all sorts of ways. This allows an investor to purchase a fund with almost any desired characteristics.
Let’s go through the name of this ETF and see what each of the parts means.
Invesco is a large investment company which manages this fund. They manage $1.4 trillion dollars in all their funds combined.
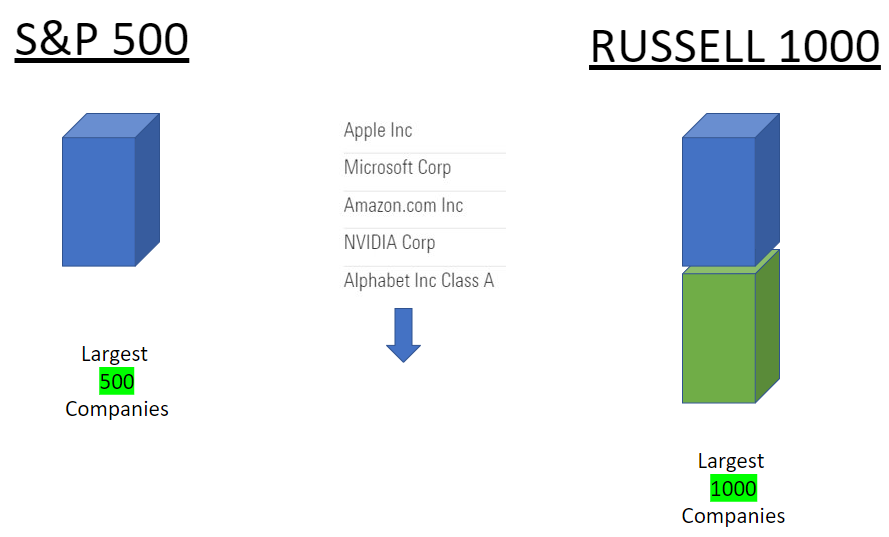
Russell 1000 is a stock index. You’ve probably heard of the S&P 500 Index. Well, the Russell 1000 index covers the same 500 stocks as the S&P 500 plus the next 500 largest stocks.
Dynamic means that the holdings in this fund change according to predetermined triggers. With a standard index fund such as the S&P 500, the holdings change infrequently. OMFL on the other hand is reconstituted and rebalanced monthly based on various economic indicators.
The way this works is that each of the 1000 securities are assigned a multi-factor score for each of five investment styles. Those styles are value, momentum, quality, low volatility, and size.
Depending on which stage of the economic cycle we are in, the fund overweight’s two or three of the five factors.
The bottom of this diagram shows that in an economic recovery phase the fund would emphasize size and value. When the economy moves into an expansion phase, the fund would add stocks that ranked high in the momentum score along with size and value.
Where we are now, in an economic slowdown, the fund should be invested in companies that scored high in quality and low -volatility.
Using PortfolioVisualizer.com, we can check and see how this OMFL fund has compared in performance to the iShares Russell 1000 ETF (symbol IWB), which is a standard Russell 1000 ETF.
This result is showing from 2018 until March 2023. Ten thousand dollars invested in January 2018 would now be worth almost $19,000 if it was invested in OMFL and $16,000 if it was invested in the standard Russell 1000 Index fund. That’s a big difference! 3.7% annually.
The standard deviation was higher, but the best year was larger than the standard index. The worst year it lost less, and the max drawdown was less.
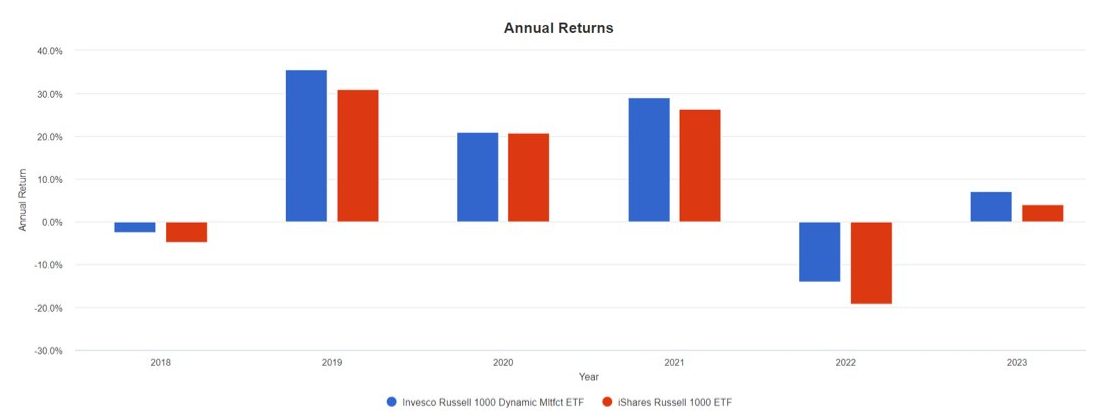
This next diagram shows annual returns by year. The blue bars are the OMFL fund, and the red bars are the standard fund.
You can see that in every single year the blue bar is better than the red bar.
In 2018 there was a trade war with China and the stock market was negative for the year. OMFL lost less that year than the index. (OMFL: -2.57%, IWB: -4.88%)
In 2019 the economy was growing quickly, and the stock market did very well. OMFL did even better. (OMFL: 35.58%, IWB: 31.06%)
In 2020 Covid shut down the world economy. In one year, we went from growth to recession and back to growth when the government stimulated the economy. In 2020 OMFL did slightly better than the standard index fund. (OMFL: 20.96%, IWB: 20.77%)
In 2021, a growth year, OMFL beat the Russell 1000 again. (OMFL: 28.96%, IWB: 26.32%)
Last year the index was down big. OMFL lost less. (OMFL: -13.97, IWB: -19.19%)
So far this year in 2023, OMFL has beaten the index again. (OMFL: 7.13%, IWB: 4.1%)
OMFL has been in existence for more than five years and it has beaten the index in every stage of the economic cycle. I think that’s really impressive, and it shows that the rules that govern this fund’s reconstitution are effective.
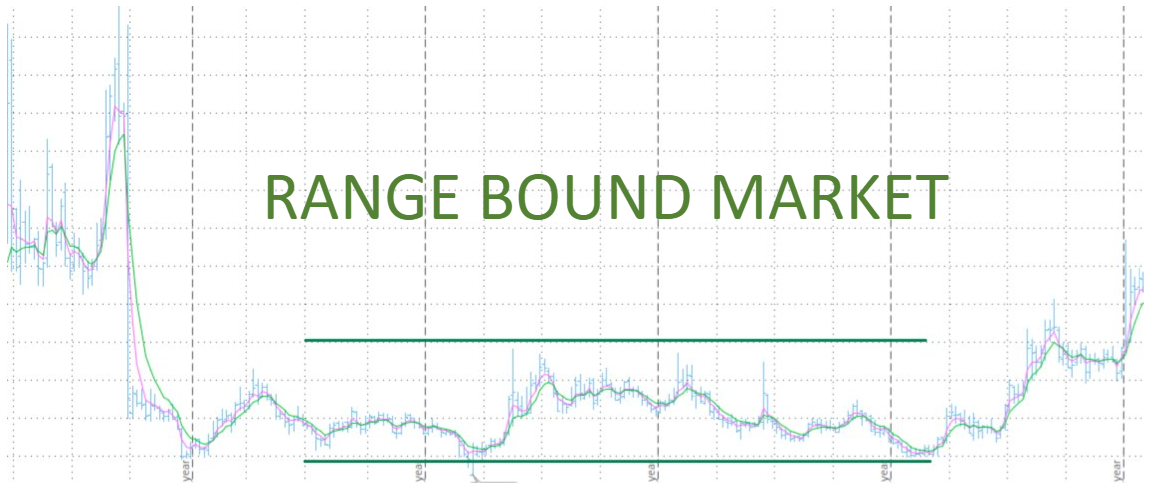
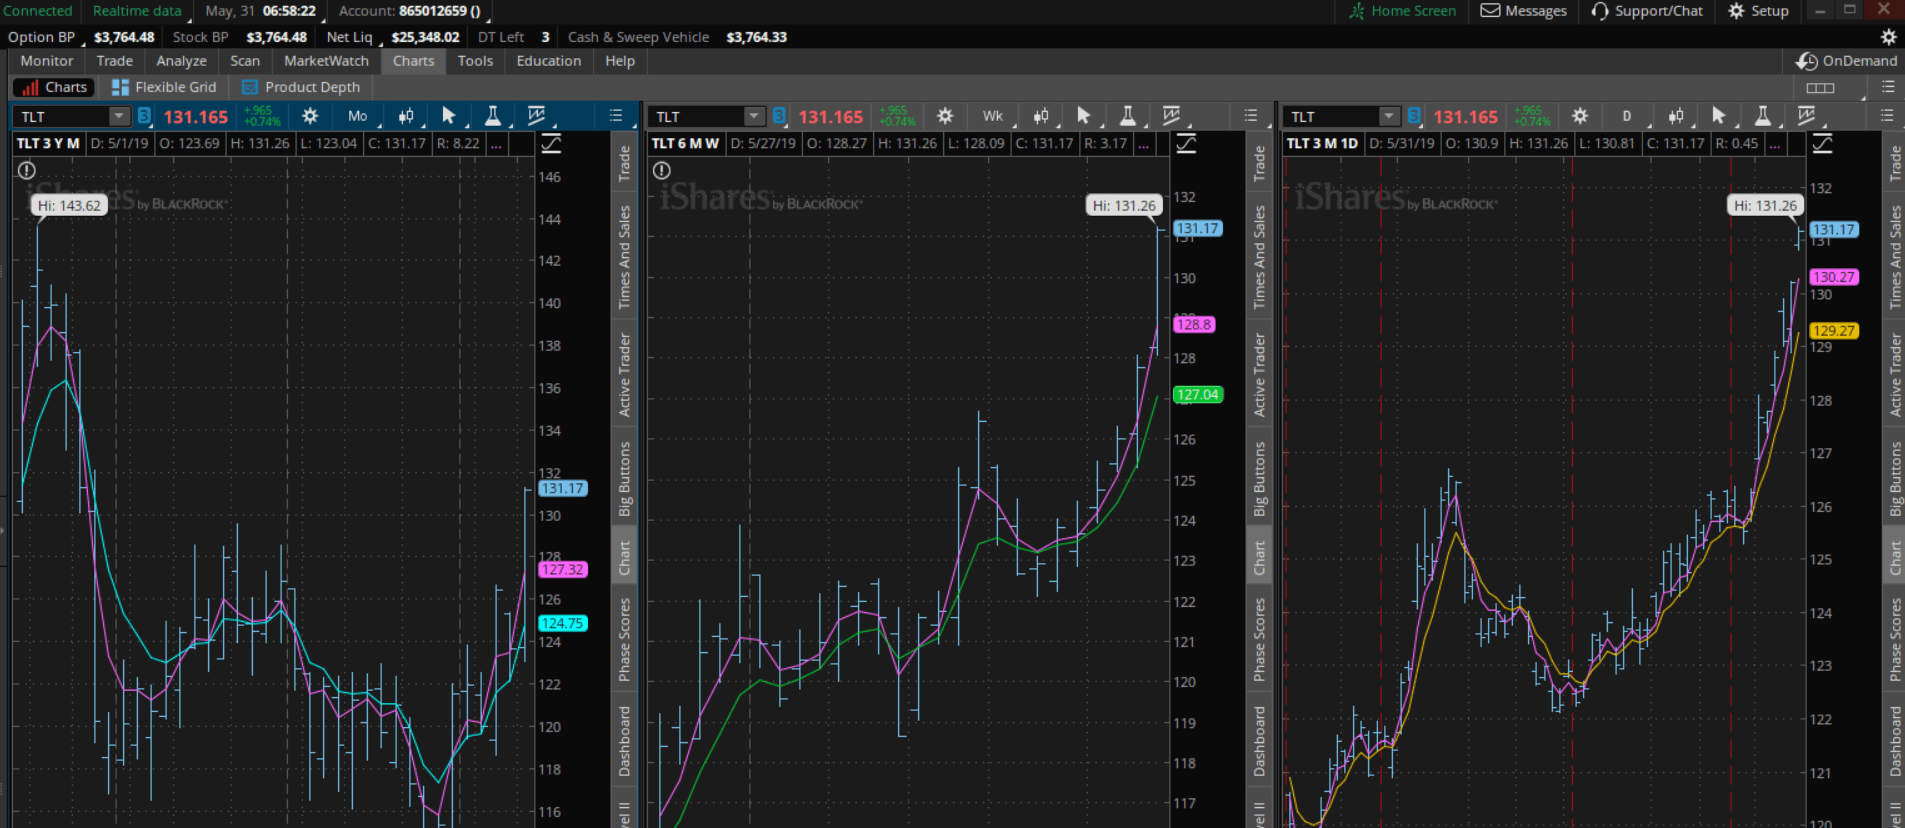
One thing we haven’t seen is how OMFL performs in range-bound markets. A range bound stock market is one that oscillates between a high and low for months at a time without really moving higher or lower.
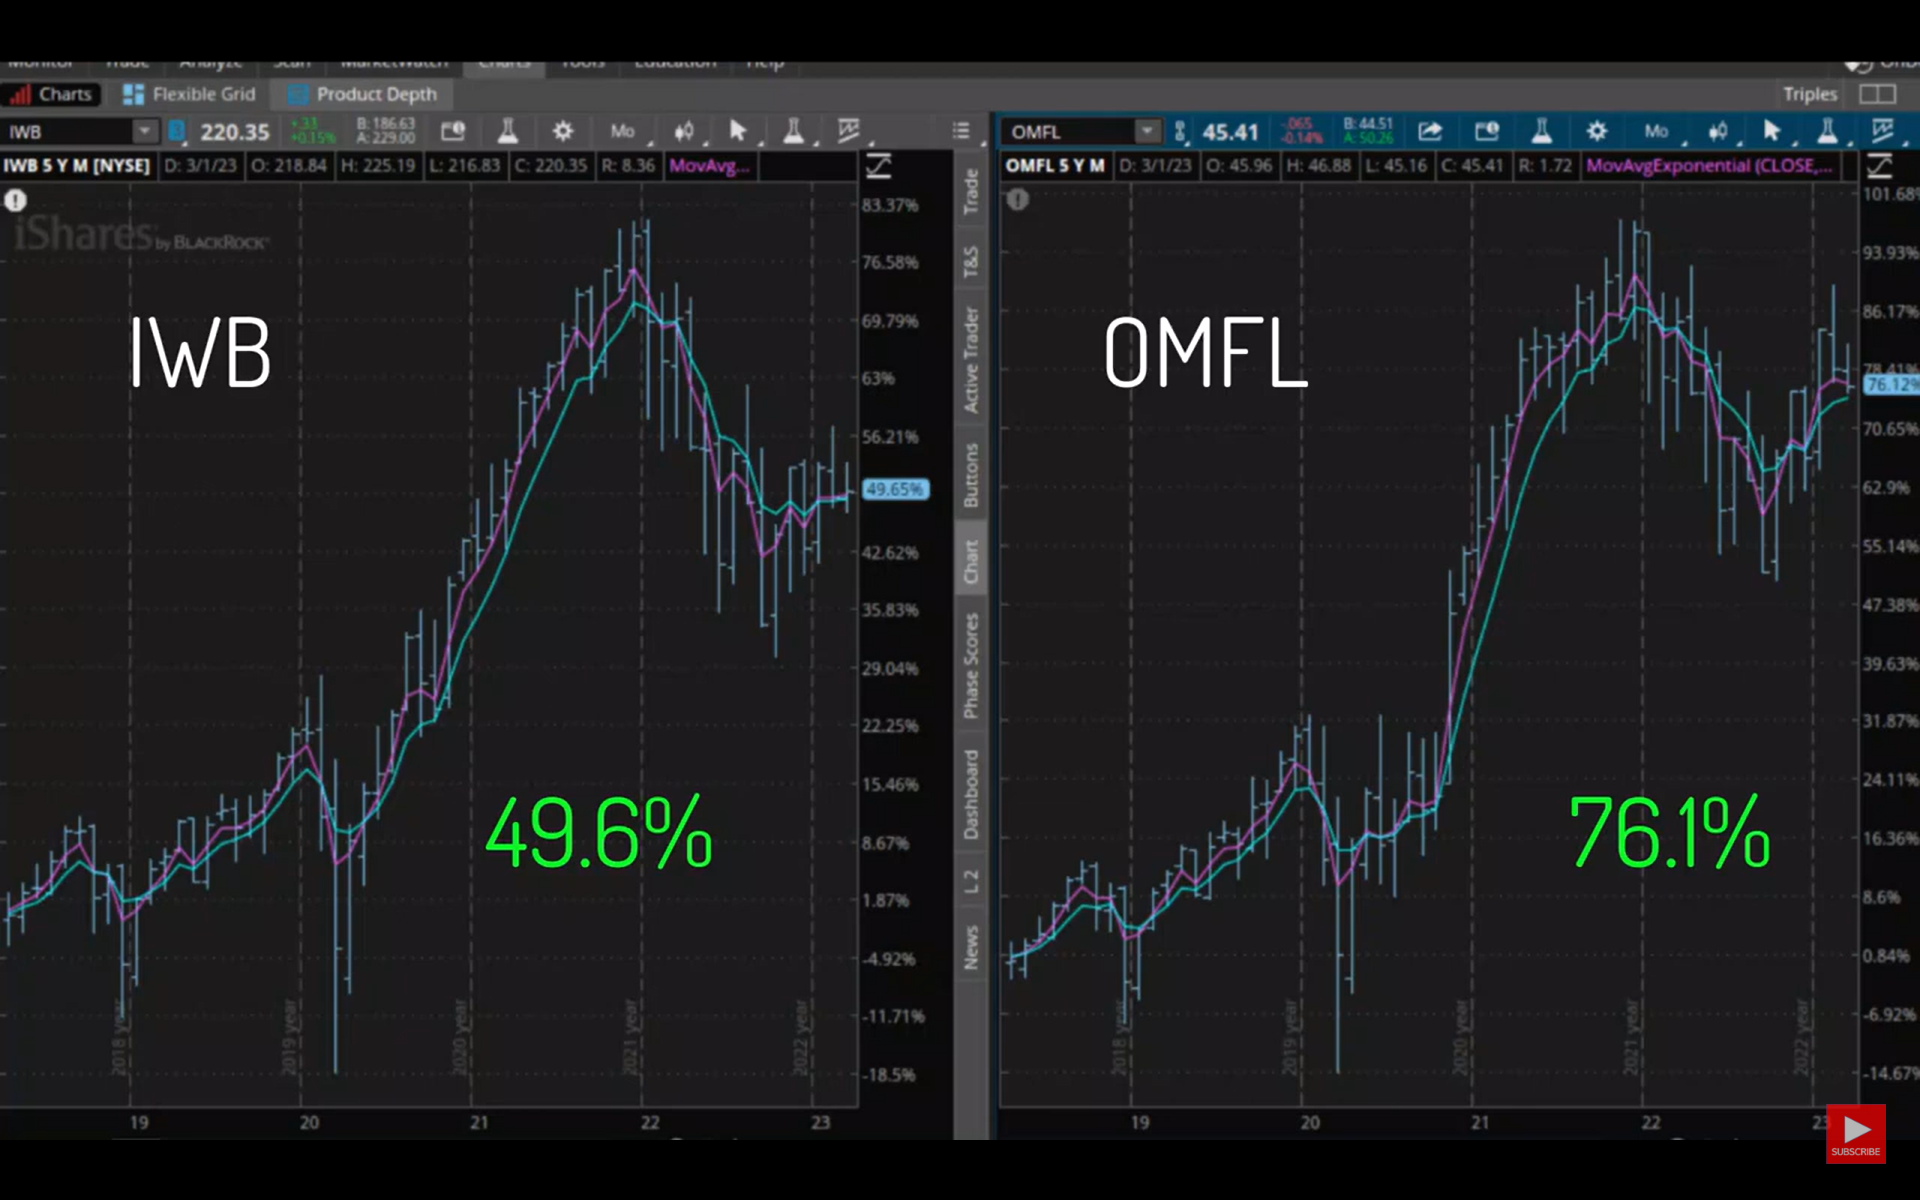
The stock market has been trending up or down in the last five years. In these two stock charts, we are seeing the iShares Russell 1000 Index Fund (IWB) on the left and OMFL on the right. They both are showing five years’ worth of returns.
IWB on the left is up 49.65%. OMFL, in the exact same amount of time, is up 76.12%. That is a big difference.
If you are looking to invest in a fund that has a good chance of performing better than a standard index fund, then I think you should consider researching this Invesco Russell 1000 Dynamic multi-factor fund symbol OMFL further.
Remember that just because this fund has outperformed the index in the past, does not mean this fund is guaranteed to outperform the index in the future.
Also, this is not a recommendation to buy this fund. This is not personalized financial advice.
It is important to understand that just because the stock market has done very well in recent memory (2022 excluded), does not mean that will always be the case. It can be easy to assume that stocks always go up faster than everything else. However, it is entirely possible that 2022 turns out to be similar to 2000 and the next 12 years parallel 2000 to 2012.
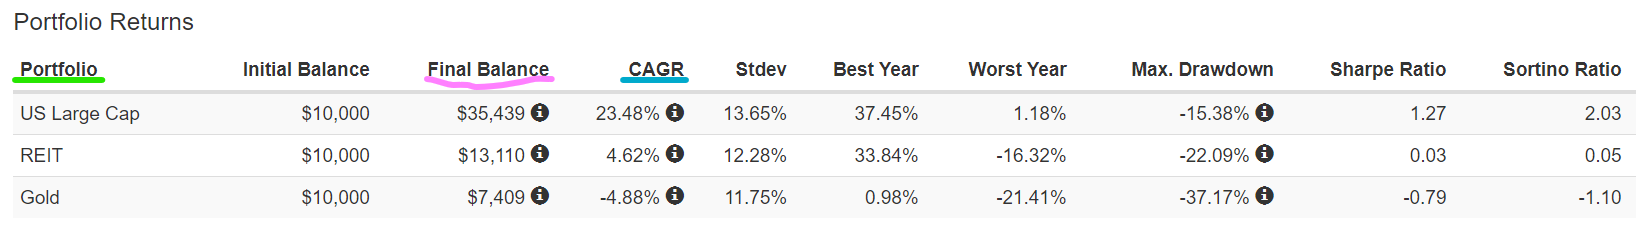
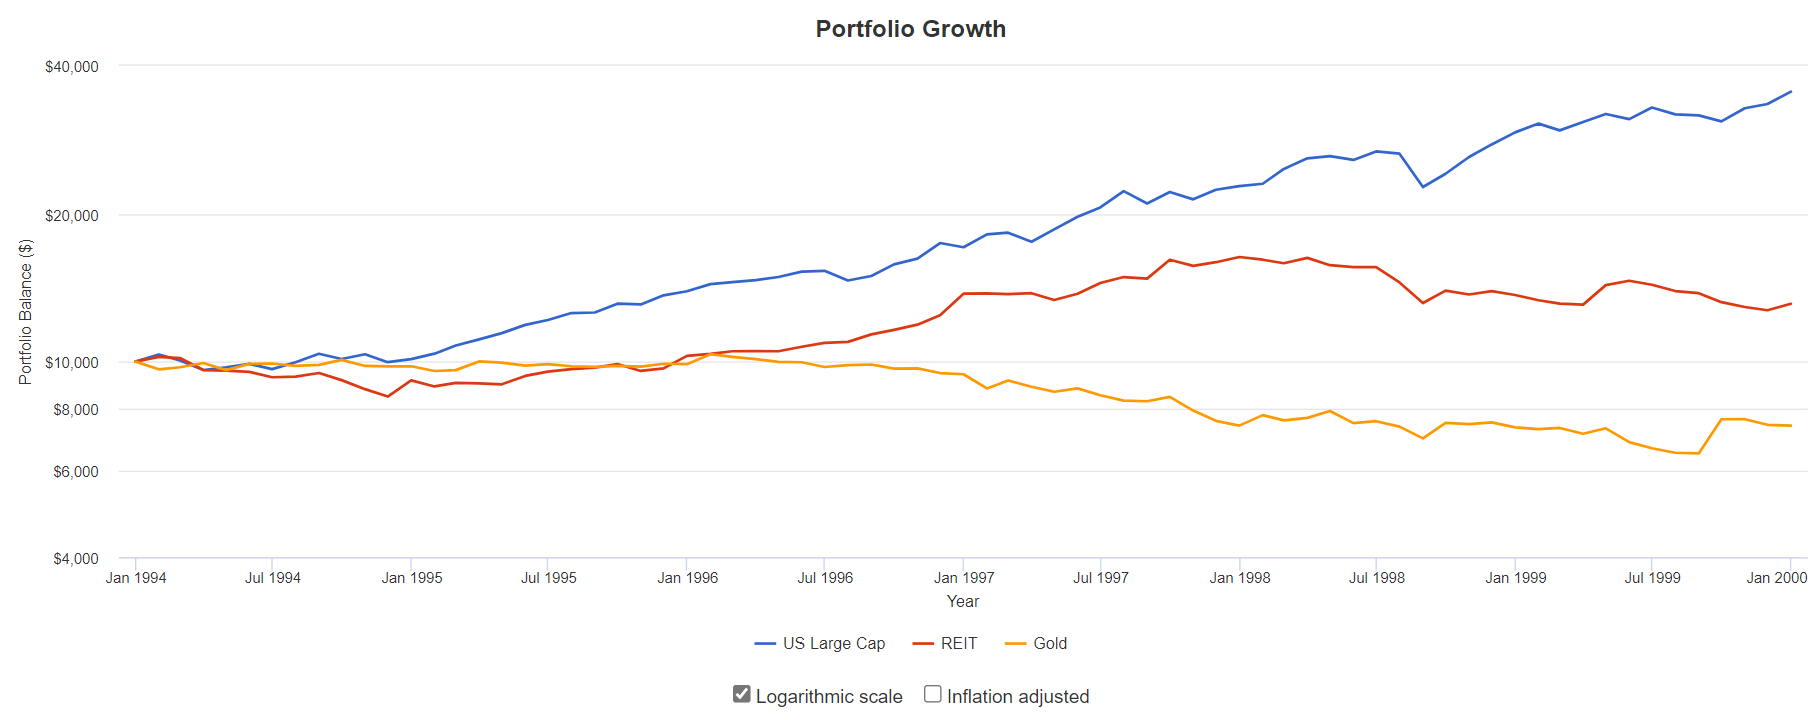
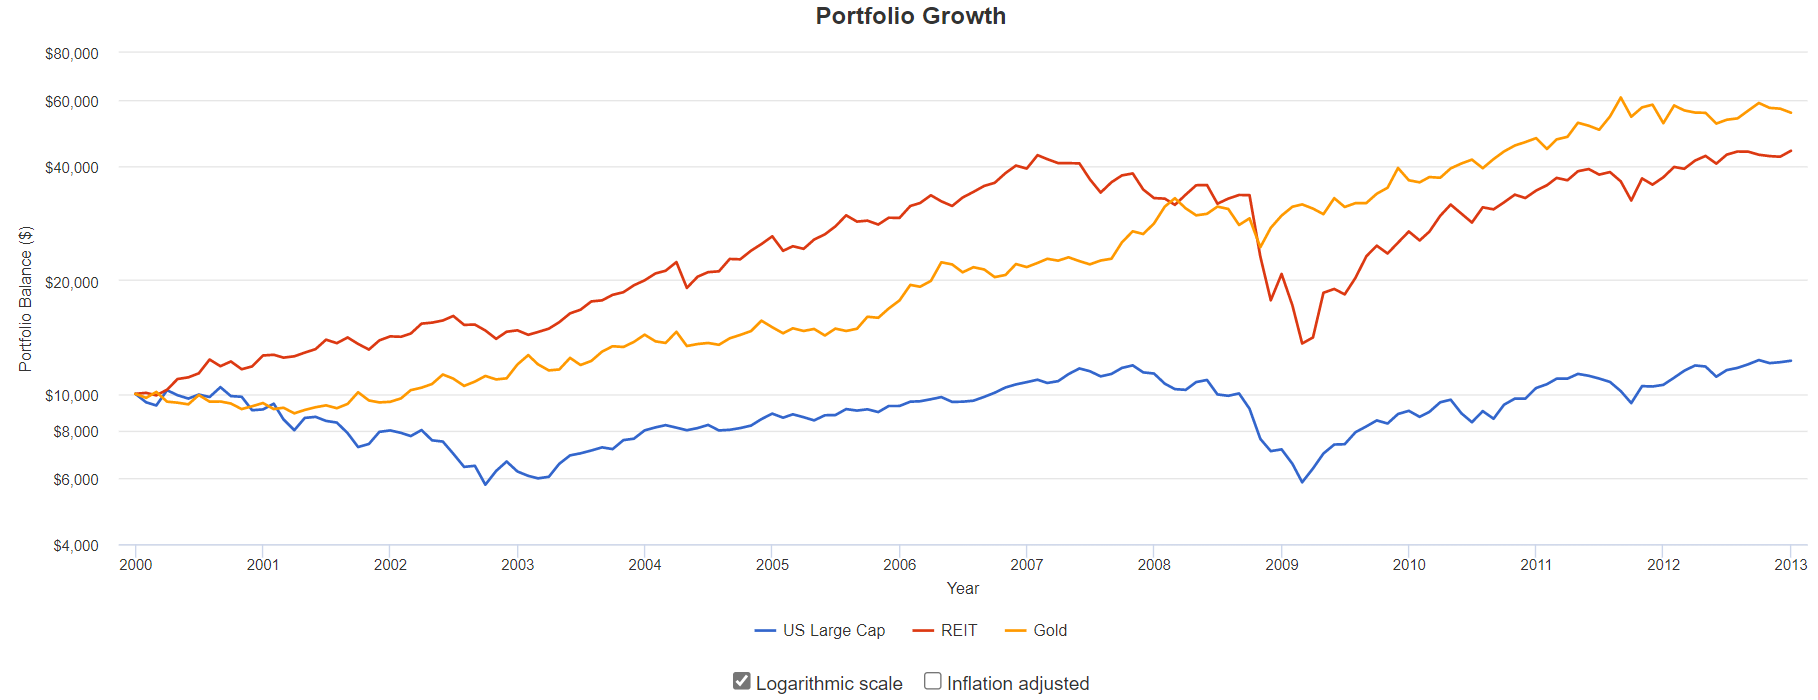
The following graph shows the performance of three asset classes from 1994 through the end of 1999. They are large cap stocks (such as the S&P 500), real estate, and gold. The blue line shows stock returns, the red line shows real estate and gold is the yellow line.
By December 1999, $10,000 invested in stocks in January 1994 would have turned into $35,439. A $10,000 investment in real estate investment trusts would be worth $13,110 and $10,000 invested in gold would have gone down in value and would have been worth $7,409.
Someone investing additional money at the start of 2000 probably would have felt that the best investment was the stock market. After all, investors more than tripled their money in stocks over the previous six years. It would have felt like the stock market was bound to continue going higher and investing in gold or real estate was sure to limit their investment portfolio returns.
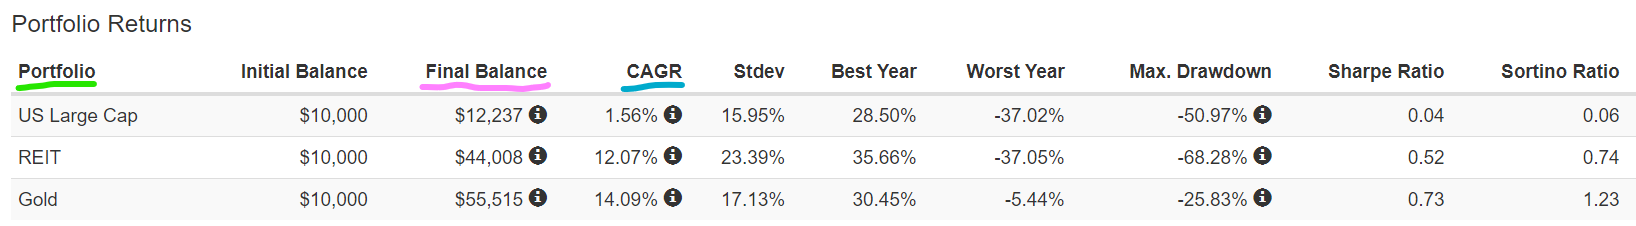
The next graphic shows what actually happened over the following 13 years. The blue line again is stocks, the red line is real estate and gold is the yellow line.
Stocks ended the thirteen years from 2000 through the end of 2012 with an average annual return of only 1.56%. There were many years (September 2000 to September 2006 and September 2008 to December 2010) during that time frame when the stock investments were below their January 2000 value. Over the same period, real estate was up 12% per year and gold was up 14% per year.
Owning just stocks turned out to be anything but a sure thing.
Things could happen in the future to the economy, world politics, the climate, and other areas which may limit stock increases over the coming years. I am not making a market prediction here, but my point is that past performance does not guarantee future results.
To overcome the unknowns of the future, we need to spread our investments over multiple asset classes or investment types.
When you invest new money or rebalance your investments today, you should be concerned about future performance and not assume that stocks will continue to outperform.
If you have questions or concerns about your portfolio allocation, please contact me today.
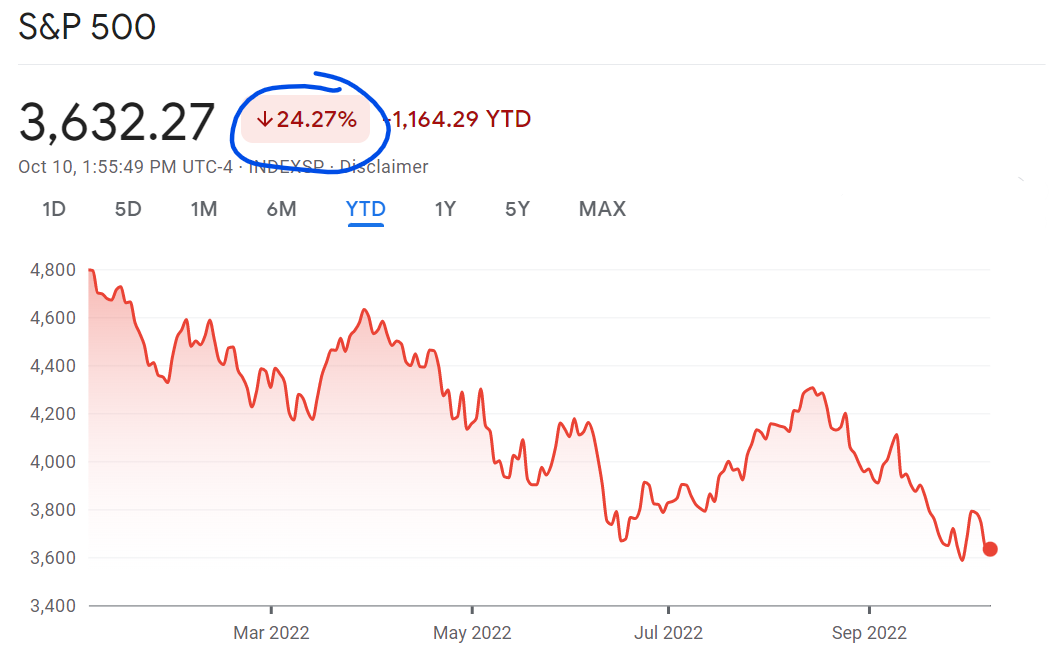
As I am sure you know, the stock market in 2022 has had a terrible year. As of October 10th, it is down 24% for the year. Could the bottom be near, and the markets go higher from here?
The Federal Reserve has been raising interest rates to fight inflation. Rising interest rates make business and personal loans more expensive which slows down the economy. With a slower economy, inflation should be lower.
In a full economic cycle, growth slows down as loans get more expensive. This slowing leads to some businesses struggling and needing to lay off workers. In the current cycle, businesses have yet to lay off workers. In fact, they are still hiring more employees.
On Friday, October 7th, the September jobs report was released, and 263,000 new jobs were created. Increasing jobs means the economy is still running well. Unemployment decreased to 3.5%.
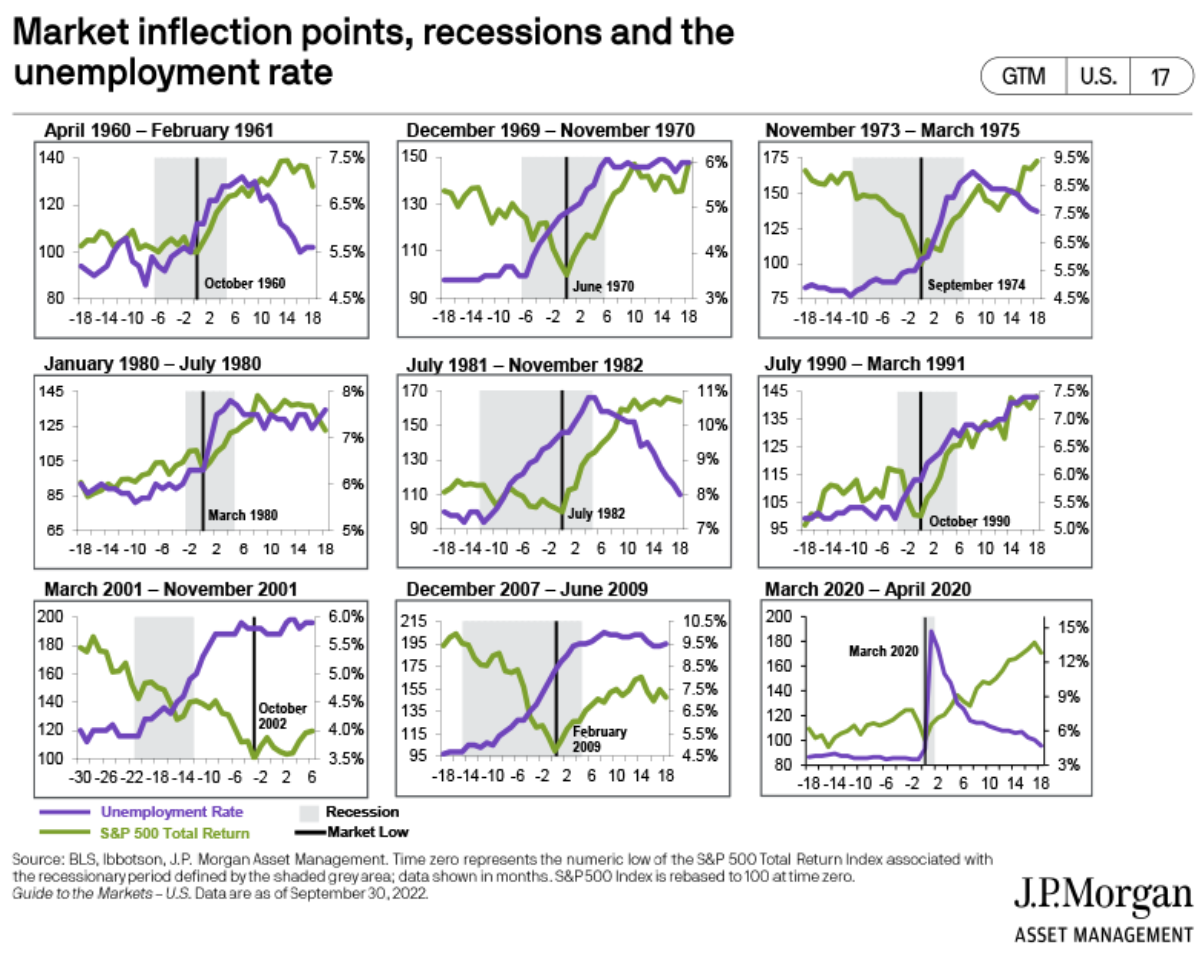
According to JP Morgan’s research in their Guide to the Markets, unemployment increases before the market hits a bottom. This can be seen in the following charts of market bottoms. The unemployment rate is the purple line, and the market bottom is the black, vertical line. In each case, the unemployment rate (purple) was increasing before the market bottomed.
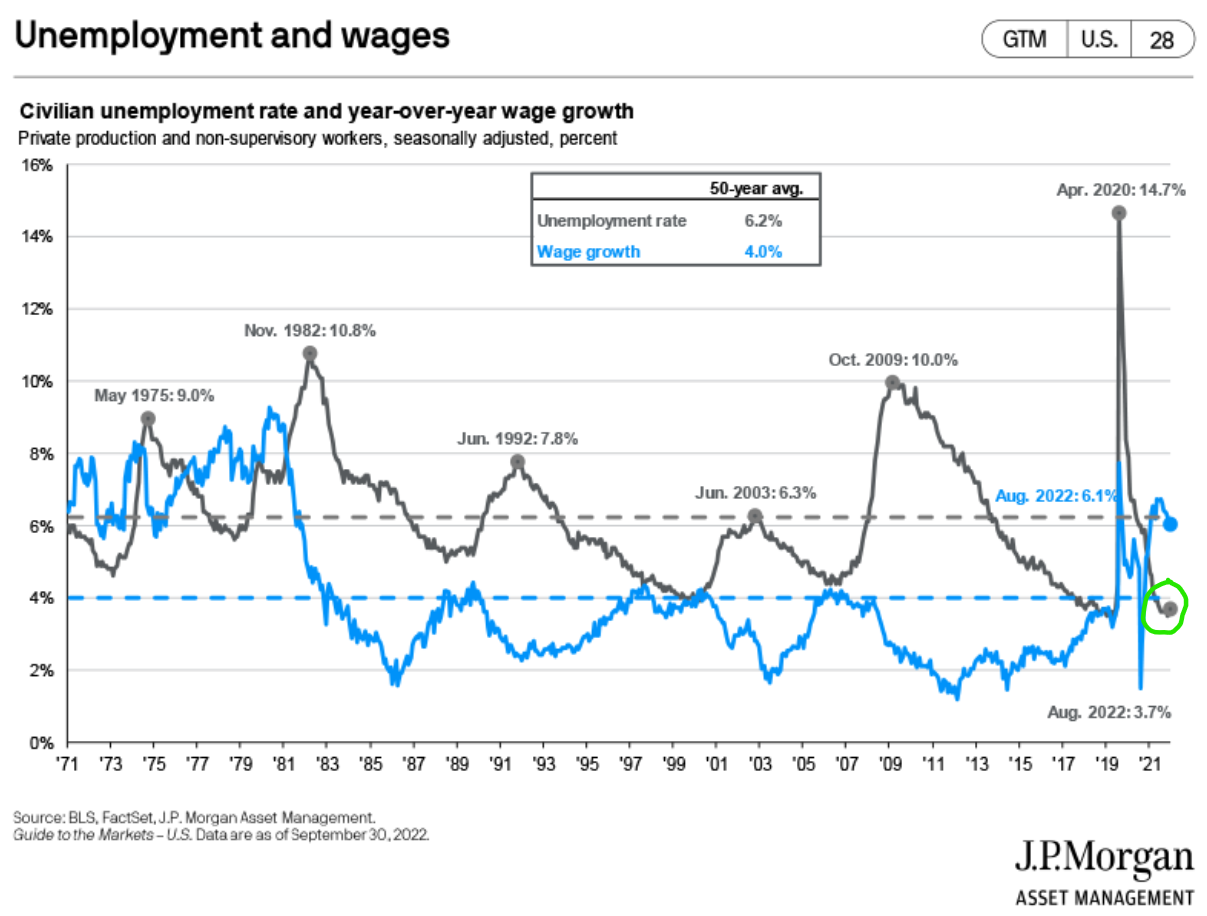
The current 3.5% unemployment rate is low and has remained low these past several months, even with the Federal Reserve quickly raising interest rates. There is no sign of increasing unemployment at the current time. The next graph shows the unemployment rate as a grey line with the current rate circled in green.
As the Federal Reserve continues raising interest rates, the economy will eventually slow, and workers will be laid off. Until that slowing happens, watching the unemployment rate should give us a hint for when the stock market is approaching its bottom.
If the unemployment signal holds during this downturn, as it did in the previous economic downturns, then we are still months away from a market bottom.
If you follow financial news, you will have seen reports about the Federal Reserve’s new inflation target. Rather than using their goal of a 2% cap on inflation, the Federal Reserve would like to see inflation average 2% over an extended period of time.
This sounds like a subtle change, but it may have big repercussions.
Why does the Fed want a higher rate of inflation?
A continual low level of inflation is desired. When [consumer] prices are going up, people want to buy now rather than pay more later. This increases demand in the short term. As a result, stores sell more and factories produce more now. They are more likely to hire new workers to meet demand. It creates a virtuous cycle, boosting economic growth. [Source]
This boost to the economy is what the Fed is trying to create. A little boost would help get us out of the coronavirus slump. If the boost is allowed to continue uncapped, however, things could get out of control.
I believe that by removing their 2% cap on inflation, the Federal Reserve is returning to the Alan Greenspan years. With Mr. Greenspan as Chair, the Federal Reserve did not preemptively raise interest rates to keep a lid on the economy. They raised rates too late.
Throughout the 1990’s the economy grew until peaking with the Dot com bubble bursting in 2000. Then in 2007 we had the housing bubble. In both instances, the Federal Reserve did not raise interest rates quickly enough to keep inflation in check.
It was after these two bubbles that the Federal Reserve switched to the idea of capping inflation in January of 2012. Now they are going back again.
I reason that if the Federal Reserve goes back to its previous policy, then we should expect the same results. I think we will again see bubbles, and most likely, they will be in the same places as last time.
One could argue the stock market is already approaching a bubble in tech and other popular stocks like Tesla. Since the Coronavirus-19 lockdown many people have felt that tech stocks are a can’t lose investment and have been continually buying. The tech company Snowflake became the largest IPO ever, but it doesn’t make a profit. Sounds a bit like 1999.
There is a reason that tech stocks and real estate were the two places for bubbles last time and possibly next time. With low interest rates like we have now, there is no income reward for owning bonds. Earning 0.85% per year on a 10-year Treasury bond is not a worthwhile investment for a lot of people. Therefore, they move their money where they will get returns. That means stocks and real estate.
If the Federal Reserve delays raising rates, there is going to be easy money around for several years. Where will that easy money go? Into business investment (stocks) and into real estate.
As investors we need to stay with the investments that are going to attract cheap money and benefit from low interest rates. That means continue to own your stocks and buy real estate (REITs or individual properties) if you don’t own some already.
I want to show you how to replicate the Vanguard Personal Advisor Services investments with another Vanguard offering, possibly saving you thousands of dollars per year.
There is a certain allure to the Personal Advisor Services because Vanguard will invest your money in Vanguard funds and take care of the hassle of maintaining your portfolio at your recommended asset allocation. When you sign up for the service, you will take a risk tolerance questionnaire, and Vanguard will determine the correct allocation for you after taking your goals into consideration. After signing up, there is no work left for you to do, Vanguard will take care of the ongoing investment management.
Before you rush off to sign up, let’s take a look at some of the fine print in the Vanguard personal advisor services brochure.
(page 2, right column)
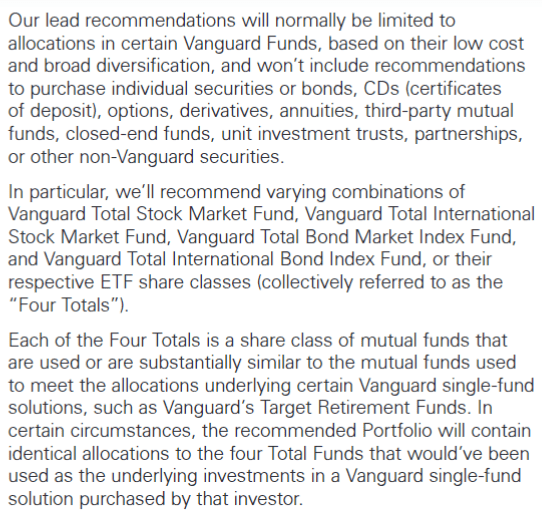
Paragraph 1: “Our lead recommendations will normally be limited to allocations in certain Vanguard funds.” That’s obvious. Of course they will put your money in Vanguard funds, so no surprise there.
Paragraph 2: the details of which Vanguard mutual funds will be used by the Personal Advisor Services are laid out right in front of you.
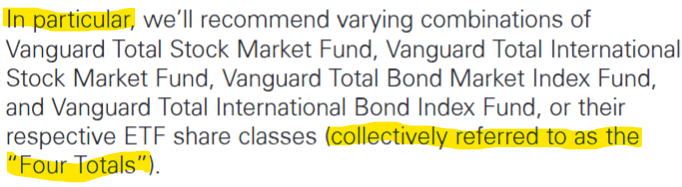
So, your Personal Advisor Services allocation may / will be composed of 4 funds: The Vanguard Total Stock Market Fund, Vanguard Total International Stock Market Fund, Vanguard Total Bond Market Index Fund, and Vanguard Total International Bond Index Funds. This is especially true if you are investing cash with the Vanguard advisor services, as opposed to turning over a portfolio of funds you already own.
Paragraph 3: they lay out exactly how you could copy the service.
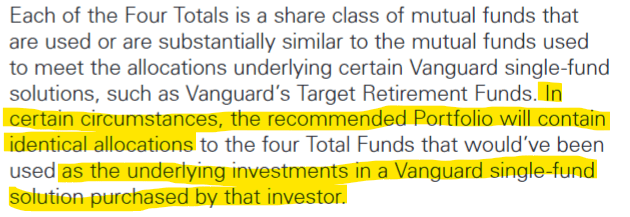
They state, “each of the four totals …are substantially similar to the mutual funds used to meet the allocations underlying certain Vanguard single fund solutions”. In other words, there are mutual funds at Vanguard that are comprised of these four funds.
As we continue reading this third paragraph of fine print here’s the real kicker: “In certain circumstances, the recommended portfolio will contain identical allocations to the Four Total funds that would have been used as the underlying investments in a Vanguard single-fund solution”. Oh my.
Vanguard just told us that their Personal Advisor Services will be or may be an exact replica of a single fund that is already available at Vanguard.
I found these single funds that replicate the Personal Advisor Services. They are named Vanguard LifeStrategy funds.
Vanguard LifeStrategy funds
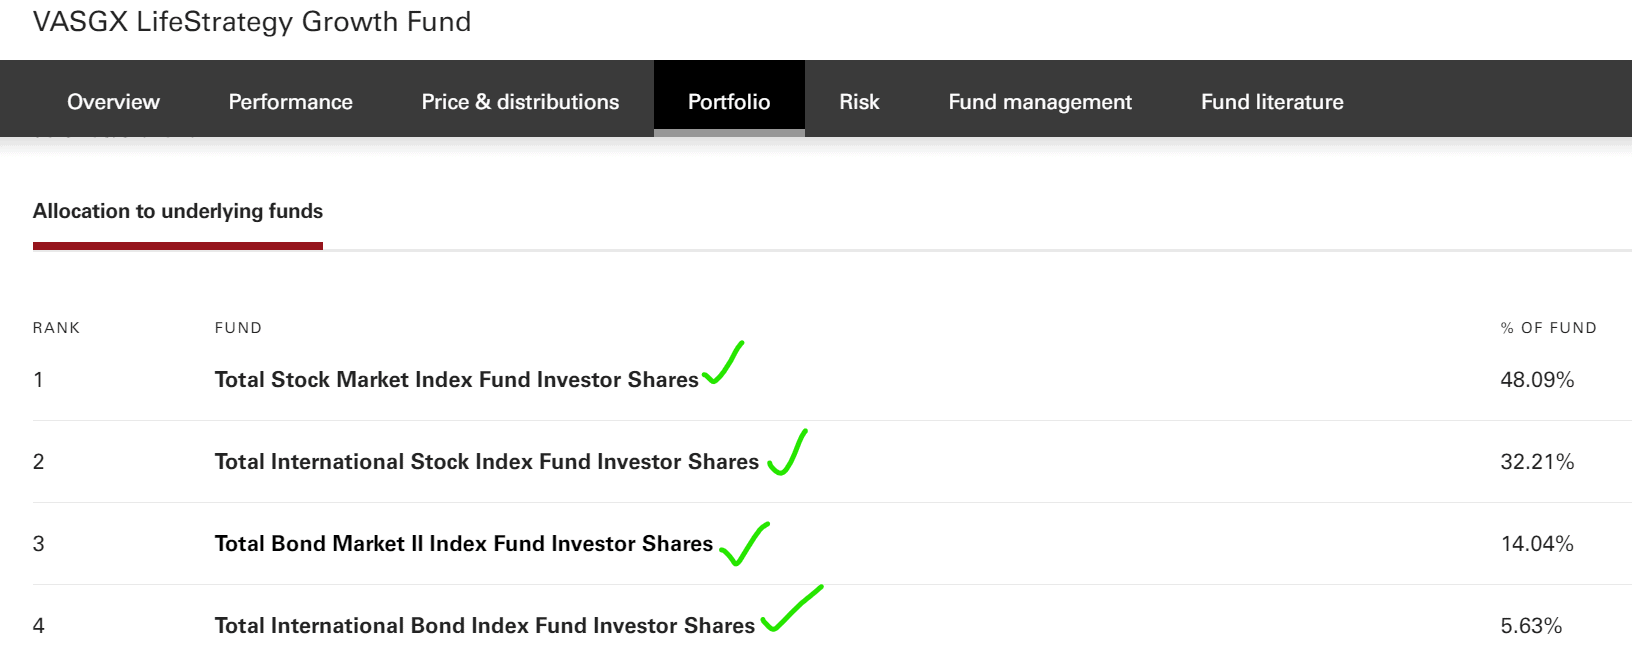
There are four LifeStrategy mutual funds which are comprised of various combinations of the big Four Total funds (Vanguard Total Stock Market Fund, Vanguard Total International Stock Market Fund, Vanguard Total Bond Market Index Fund, and Vanguard Total International Bond Index Funds). The LifeStrategy funds come in various target allocations.
Income fund (VASIX) – allocation of 20% stocks & 80% bonds.
Conservative growth fund (VSCGX) – 40% stocks & 60% bonds.
Moderate growth fund (VSMGX) – 60% stocks & 40% bonds.
Growth fund (VASGX) – 80% stocks and 20% bonds.
The characteristic that makes these funds a replacement for the Vanguard Personal Advisor Services is the fact that they automatically rebalance the four holdings within them to keep the allocation at the desired level. The ongoing management is done for you, by the fund, not by a manager for an additional fee.
Handing off the hassle of rebalancing their investments is a major reason why people (especially retirees) sign up for the Personal Advisor Services. Instead, they could buy a LifeStrategy fund.
Cost Savings
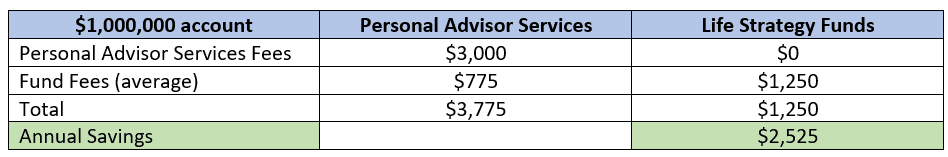
The Vanguard Personal Advisor Service charges 0.30% of the amount you have invested each and every year. That means for a $500,000 investment, you will pay Vanguard $1,500 to manage your investment for you. That is in addition to the fund fees which range from (0.04% to 0.11% annually).
If you open a Vanguard account and buy a LifeStrategy fund, you will pay only the LifeStrategy fund fees (0.11% to 0.14% annually).
Let’s compare the fees a retiree with a $1,000,000 account will pay each year.
Using the LifeStrategy funds will save you more than $200 per month.
An additional option is to use this savings to get annual financial planning improvements from an independent financial planner like Andrew Marshall Financial, LLC. We give clients objective advice that considers all aspects of their life, not just the accounts invested at one company. We can help you set up your Vanguard accounts to use LifeStrategy funds and much more. Click here to set up a free video call.
There is a class of stock funds marketed as being “less risky” than the general market. They are called low volatility or minimum vol. ETFs.
I will compare three popular low volatility ETFs funds to the S&P 500 index fund (SPY) to see if indeed they reduced the risk that investors have had to go through so far in 2020.
When I think of a fund that provides “potentially less risk” than the broad S&P index, I imagine a fund that will experience a smaller loss (by several percentage points) than the overall market when the stock market is going through a rough patch.
This year, 2020, is certainly one of those rough patches.
How did these 3 low volatility ETFs compare with the SPY index fund?
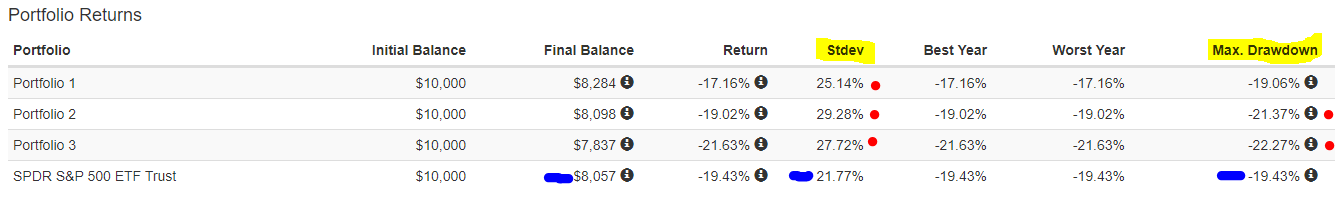
Portfolio 1 = USMV Portfolio 2 = SPLV Portfolio 3 = VFMV The benchmark we are comparing everything to is on the bottom row of the chart – SPY ETF (blue marks).
I want to draw your attention to the far-right column. This Max. Drawdown column tells us the largest percentage lost during 2020 (using end of month values for each fund). In other words, the drawdown could have been larger at some point during one of the three months so far in 2020, but if you opened your statement at the end of each month, this number is the largest loss you would have seen.
Obviously, we want this number to be as small as possible. When I think of a low volatility investment, it should have a smaller max. drawdown than the standard ETF. At least that is how I would define low volatility.
That wasn’t the case for two of these min vol funds, and the other was only 0.37% better than the benchmark. In dollar terms that would be a $370 smaller drawdown for each $100,000 invested. That’s basically even.
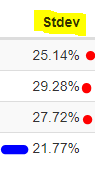
Another column that shows these min. volatility funds are falsely named and not worth buying is the “StDev” (annualized standard deviation of monthly returns) column. Standard deviation is a measure of how much the returns move up and down from their average return.
For each low vol fund, the standard deviation is higher than the benchmark S&P 500!
Low vol ETFs with high standard deviations? That is a total fail by these funds.
The lesson here is that when you consider buying an investment fund, you need to understand what the fund actually holds and how its strategy is designed to make money. The fund’s name can be misleading.
These “low volatility” funds are just a collection of stocks that have moved up and down less than the others in the index over the last 12 months. There are no safeguards or uncorrelated assets that would limit the volatility. There is nothing these funds are doing that provides protection against down markets.
As we have seen in 2008 and 2020, when there is a shock to the market, all stocks go down. Regardless of whether or not they are named “low volatility”.
In this post I will explain why I think the answer is yes.
Charles Schwab Inc. is a huge investment company known for offering lowcost investments. They are the original discount broker.
Robo advisors are automated, computer-based, systematic traders.A robo advisor is an investing tool that automates the ongoing account management steps that must be completed annually and when money is contributed or withdrawn from an account.
Robo advisors offer various investment allocations (stocks, bonds, etc.) and automatically re-balance the allocation according to certain rules.
The fact that there is a computer doing all the work means the cost is much lower than hiring a real person to oversee your investment management.
Robo investing can be especially useful for someone who is in the accumulation stage of life. One can set up a direct deposit, say $1000 a month, from their checking account. The deposit goes to their robo advisor and the computers automatically invest that additional $1000 each month in the chosen allocation.
There is no effort needed oncethe initial roboaccount and $1000 monthly deposits are set up.
That saves a lot of time for someone who’s contributing additional money, but what about a retiree who is no longer making additional contributions and who has plenty of time to manage their investments?
Just like someone in the accumulation stage, a retiree in the decumulation stage would prefer not to spend the time to log into their accounts or make a phone call to withdraw money or to re-balance their accounts every quarter, 6 months, or even once a year. That’s just a hassle, and as they get older, it might get more difficult to handle.
Here are 7 reasons why Schwab Intelligent Portfolios® are the best roboadvisor for retirees.
1. Intelligent Portfolios require a sizable allocation to cash.
Now you may not like the sound of Schwab requiring you to hold cash while they make money off your cash, but let’s think it through.
Most retirees I know are not aggressive investors and like havinga sizable amount of cash available. Maybe their cash is in a high-yield savings account or CDs, but they almost always have one to two years of living expenses in cash.
Keeping a certain percentage in cash (even 10% or more) is actually not a disadvantage. It’s something retirees would be doing anyway.
As long as the allocation to stocks is high enough, an Intelligent Portfolio investor is essentially swapping some bonds for cash (that cash earns interest at a current interest rate of 0.30% annually).
When opening an account, it is possible to adjust the stock allocation upwards to ensure enough growth in the account, even with a large cash allocation.
2.The fees = $0.
Obviously, a retirement account will last longer if one is not paying as much for investment management. One of the defining points about the Schwab intelligent portfolios is the fact there are no AUM (assets under management) fees! None!
Other roboinvesting tools such as Betterment, Wealthfront, TD Ameritrade Essential Portfolios, and others charge an annual fee of around 0.25% – 0.30% of the account value.
The reason Schwab does not charge a fee is they require a certain percentage of the account funds to be in cash. Schwab uses this cash to earn money for itself. This is not a problem for retirees – see number 1 above.
3. Schwab Intelligent Portfolios are the most diversified roboadvisor I have seen.
Maximum diversification is a benefit for retirees.
Schwab has created their own ETF’s that are not market cap weighted like typical index funds are.
The size of each stock holding within these fundamental index ETFs is based on sales, cash flow, and dividends, not price.
The Schwab intelligent portfolios service spreads one’s investments between both market cap weighted ETF’s and fundamental index weighted ETF’s. That increases diversification.
Schwab Intelligent Portfolios also spreads one’s investments across more asset classes than the other roboadvisors. Schwab includes precious metals, REITs, emerging market bonds, high-yield bonds, securitized bonds, corporate bonds, international developed bonds and others. They use up to 20 asset classes.
Maximum diversification is the best strategy for retirees. Retirees should spread their risk to help maintain their account balance should one particular type of investment experience tough times.
4. Account rebalancing is done the right way.
Accounts are re-balanced only when an asset’s allocation has drifted too far from its desired percentage.
I like the fact it is not done on a regularly timed interval but rather on a results based interval.
For example, let’s say international stocks rise and become 25% of your portfolio instead of the desired 20%. The Schwab Intelligent Portfolios algorithm recognizes this, sells some international stocks to return them to 20%, and buys bonds or other assets to rebalance their allocations. That’s the best way to rebalance an account.
“Importantly, while portfolios are monitored daily, rebalancing occurs only as needed when an asset class drifts far enough from its intended weighting in the portfolio to warrant a rebalancing trade. That typically results in a couple of rebalancing events per year in an average market environment. In a more volatile environment, the number of rebalancing events might be a bit higher, and in a very calm market environment it might be lower.”
5. Automatic withdrawals can come each month to your checking account.
Beginning January 2020, Schwab is starting a new service named Schwab Intelligent Income. Schwab Intelligent Income works in conjunction with Schwab Intelligent Portfolios to calculate a safe withdrawal rate and transfer that amount from your investments to your checking account each month. That gives you the money needed to live on each month, as if you were still earning a paycheck.
6. Charles Schwab is a massive company.
You should feel comfortable investing with Charles Schwab because it’s too big to fail. One of the lessons of the financial crisis was the fact that the government can’t let huge financial institutions go under. It causes too many job losses and destroys confidence. The entire system is held up on confidence, so letting banks fail is not something the government will do anymore.
7. Easy access to your account info.
With the Schwab Intelligent Portfolios, you can access your accounts any time and any place that you have internet access. You can get on the Internet and see your account performance or make additional withdrawals and contributions as the need arises.
The automation behind these intelligent portfolios makes it easy to manage your money as you get older and perhaps have less ability or interest in managing your accounts. The automation also means you do not need to pay a full-time financial advisor an AUM fee to manage these accounts.
You can hire Schwab Intelligent Portfolios do it for free and feel confident those savings are going to make your accounts last longer.
Premium Service (Extra Cost)
Schwab Intelligent Portfolios Premium is an additional service that offers access to one of Schwab’s advisors over the phone for $300 up front and then an ongoing $30 a month ($360 a year). According to the website, the advisor is a CERTIFIED FINANCIAL PLANNER™ professional.
However, because the Schwab advisor works for a broker, they are not a fiduciary and are not required to put your interest first. In fact, they are employed by Schwab, so their incentive is to make their bosses happy.
This premium service is a competitor of mine so obviously I would not recommend this paid, premium service.
You should get your investment advice from someone who will not profit from your decisions and who is required by law to put your interest first. That’s a fiduciary. I am a fiduciary as a Registered Investment Advisor with the State of California. I am also a CERTIFIED FINANCIAL PLANNER™ professional.
If you would like to talk about finding the best investment manager for your needs or other financial planning topics please schedule a meeting or phone call here.
If you receive a pension, what stock allocation percentage should you use in your investment accounts?
Every retiree or soon to be retiree needs to determine how much of their investments to place in stocks.
The standard answer for retirees is that a 50% – 60% stock allocation maximizes portfolio longevity. If a retiree receives a pension or other guaranteed income like an annuity, then 50% – 60% may not be the best answer.
Guaranteed or annuitized income increases the safety of your retirement. Someone without guaranteed income must fund 100% of their retirement spending needs solely from investments. To remain solvent throughout their lifetime, they must err on the conservative side (own a higher percentage of bonds and cash) to provide a buffer during years the market is down.
On the other hand, if you have enough guaranteed income to cover at least your basic lifestyle needs, then you can let your stock investments fluctuate without it impacting your retirement safety.
Current Research
Let’s look at what the current research has to say about the optimal stock allocation when one has various portions of their income guaranteed. The research behind the calculations comes from an article published in the Journal of Financial Planning, November 2018 issue. The article was titled “Annuitized Income and Optimal Equity Allocation” by David M. Blanchett, Ph.D., CFA, CFP® and Michael Finke, Ph.D. CFP®.
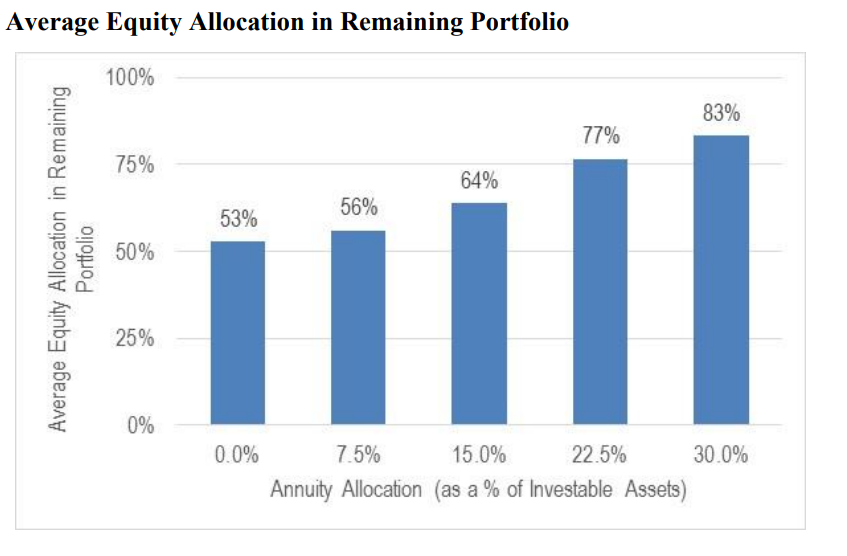
The results are based on a couple both age 65 who will live slightly longer than the Social Security mortality rates predict, and their guaranteed income increases each year with inflation. The following chart shows the results combined into graph form to show the average allocation to stocks when compared to percentage in annuitized income.
The trend is clear. The more guaranteed income a retiree has, the higher the optimal allocation to stocks. This is due to the safety the guaranteed income provides.
Pensioners and annuitants can handle more market volatility than other retirees.
Example
Let’s look at an example for a retired couple who have $600k of investments and would like an income of $95,000 per year, before taxes. The gentleman receives a $77,000 pension annually. To make up the difference, they must withdraw $18,000 per year from their investment accounts. That is a 3% withdrawal rate($18k/$600k).
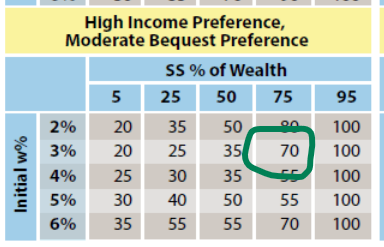
First, we need to calculate the value of his guaranteed income. These calculations are explained in this post: What is a Pension Worth?. His pension is worth $1,670,900. Therefore, the percentage of this couple’s wealth that is in annuitized income is therefore 74%:
$1,670,900/$2,270,900 = 74%
(The $2.27 million figure comes from adding his pension value to their investment value: 1,670,900 + 600,000 = 2,270,900)
Using the chart provided in the research article, they should be invested at an allocation of 70% stocks to maximize their lifetime income and legacy to their children or charities.
If you have questions about your own investment allocation or how your pension, investments, Social Security and other aspects of your finances will come together in retirement, please click here to schedule a free meeting.
Last week I attended the IMN Global Indexing and ETFs conference in Dana Point, California. One excellent benefit of living in North County San Diego is that many investment and financial planning conferences come to San Diego or Orange County. That makes it easy for me to attend.
I have been to this particular conference for four straight years now. In the past it has given me good insight into how the business behind ETFs actually works. This year, I learned about some funds that are worth a closer look. Those funds are: MOAT, ESPO, and IPAY. All three of these funds are thematic ETFs.
Thematic ETFs invest in companies that fit a certain story line. Having an investing story to tell increases the ability of the fund to gain assets. In other words, it’s easier for the fund to get some publicity, which leads to investors. If an ETF doesn’t attract enough investor money, it may not be profitable for the issuer, and they may decide to close it down. When investing, we want to make sure we are investing in funds that are large enough that they are not at risk of being shut down.
The downside of thematic ETFs is their investing story line may be too trendy and not have the staying power you need as a long term investor. Some examples of this are GNRX (a generic drug ETF), OBOR (China’s One Belt, One Road initiative ETF), or SLIM (an obesity ETF).
Let’s take a look at how the three thematic ETFs I learned about at the conference compare to some broad stock ETFs. We will compare against the old standard, SPY (S&P500 ETF), CAPE (an ETF that holds 4 sectors out of 9 based on value), and MTUM (a momentum smart beta ETF).
If you have read about Warren Buffet and his partner Charlie Munger, then you are familiar with the idea of companies having a moat. Their idea is to invest in companies that are able to protect their competitive advantage. They like it when it is difficult for a new company to easily replicate what the successful business is doing. An example would be Google. It would be very difficult for a new search engine to displace Google.
The MOAT ETF takes this idea and applies it based on Morningstar’s equity research. Morningstar determines which companies have a competitive advantage and buys the stocks with the lowest price to book value. If the price of the stocks increases and is no longer a good value, it is sold and replaced with another stock that meets the characteristics.
Overall, MOAT is an interesting idea, but I think it owns too many stocks with 52 currently. I think it would be a better investment if it toughened it’s definition of wide moat and invested in fewer companies. Also, just because a company is insulated from competitors, doesn’t mean people are interested in investing in it. These companies could just as easily be thought of as boring companies that don’t need to try hard or improve shareholder value.
The ESPO fund is the VanEck Vectors Video Gaming and Esports ETF. This ETF tracks an index of companies that get at least 50% of their revenues from video game development, Esports (including events), and related hardware and software.
What are Esports? Competitive video gaming. Esports have been a quickly growing industry the past few years. The performance of this ETF mirrors that.
I have seen Esports competitions broadcast on television. These broadcasts are of professional leagues featuring teams from around the world. Esports is a global industry and big events sell out huge arenas. It is definitely a growing industry. The question is will it continue to grow? My answer – most likely yes.
IPAY invests in companies that provide payment processing services, applications, and solutions, or provide software, networking or credit card processing. The companies must have a market cap of at least $500 million to enter the fund. There are many startups in this industry and the minimum market cap means the fund only invests in established companies.
The theme of this fund is the ongoing shift away from cash and towards mobile payments. Mobile payments is more than credit cards (although in my eyes a lot of these mobile solutions are really just software placed in front of credit card processing.)
The mobile payments industry is a lucrative and therefore competitive field. These businesses work by basically writing a piece of software that enables them to become middlemen and take a percentage of the mobile transactions that occur each day. It’s a huge market and you can see why there are lots of startups trying to create a technology that catches on.
Currently, there are a lot of competing technologies and none are revolutionary. I expect a lot of consolidation to occur in the coming years as some of the technologies become more established. The trend towards mobile payments should continue and therefore this thematic ETF should do well in the coming years.
Recent results chart: (For January 2016- May 2019. IPAY began trading in August 2015. ESPO began Nov. 2018.)
Ticker
Initial Balance
Final Balance
Avg Return
St Dev
Max drawdown
Sortino Ratio
US Mkt Correlation
IPAY
10000
18109
18.98
15.97
-17.97
1.75
0.88
MOAT
10000
16153
15.07
14.36
-10.34
1.53
0.91
MTUM
10000
15960
14.66
12.04
-15.44
1.73
0.86
CAPE
10000
15670
14.05
12.63
-15.27
1.55
0.96
SPY
10000
14392
11.24
11.8
-13.52
1.27
1
These returns are only for three years time because the thematic ETFs are new. The mobile payments ETF has had the best returns recently, but is also the most volatile. The standard deviation column shows IPAY is more than 4% more volatile each year than the S&P500 ETF (SPY). The MOAT ETF has had a better return with lower volatility than the S&P500. That is a small bit of evidence that the moat story line could be true.
How do Thematic ETFs fit in your portfolio?
Thematic ETFs should be used as a “satellite” to your core equity portfolio. You may get some extra return by adding a thematic ETF to your portfolio, if the story line holds up. The majority of your stock portfolio should be in a broad market fund, with the thematic fund(s) playing a bit role.
If you would like to talk about this investing idea or other financial planning topics, give us a call at (760) 651-6315.
Disclosure: Investing has risks. This blog post is not a recommendation to buy any of the mentioned funds. Information presented is for educational purposes only and does not intend to make an offer or solicitation for the sale or purchase of any specific securities, investments, or investment strategies. Investments involve risk and unless otherwise stated, are not guaranteed.
The Best Method for Managing Your Own Retirement Investment Portfolio
Your investment portfolio during retirement must be able to handle several issues.
It must allow for withdrawals sufficient to cover your lifestyle
It must increase enough to overcome inflation
It must not sell stocks when the market is down
It must have safe investments, so your money is there when you need it
These four tasks can sound difficult, but there is a method which can achieve them.
The ideas described in this blog post come from a book titled “Living Off Your Money” by Michael H. McClung. I was very excited to read this book because it solves one of the great misconceptions I think exists in financial advice.
That misconception is the idea that account rebalancing is helpful to client account size. It is not. The Living Off Your Money book details a better way to manage a retirement portfolio. Mr. McClung’s new strategies are named Prime Harvesting and Alternate Prime Harvesting. They are very similar, just the amount of stocks that are sold is different. Both improve on typical rebalancing.
Typical Account Rebalancing
As someone who has studied investing and traded in stocks and futures using a trend-following technique, I know that stocks making new highs tend to continue making new highs. It is by letting these winners run that big gains are made. Selling early in a big run up cuts these gains off before they become significant.
A financial advisor or investor using the typical account rebalancingtechniques each year will sell the best performing asset each year because that asset (stocks or bonds) will be a larger percentage of the portfolio by the fact that it outperformed the other asset that year. So, if stocks have a good year, and say they have risen to 60% of the portfolio when a 50/50 portfolio is desired, then stocks will be sold that year to fund withdrawals. That leaves fewer shares of stock funds owned, thereby limiting returns, if stocks have another good year.
But is there a better way? One with some data behind it to prove that it is better?
Income Harvesting
Michael McClung uses the term income-harvesting strategy todescribe the process of funding withdrawals. What is an income-harvesting strategy?
Income-harvesting strategies “specify what’s sold to fund withdrawals, what triggers rebalancing, and how rebalancing takes place.”
Mr. McClung’s idea, which I think is genius, is to sell bonds to cover your living expenses. He only sells stocks when they are up an inflation adjusted 20% from the last time stocks were sold. He names his strategy Prime Harvesting and has a similar one named Alternate Prime Harvesting.
Not selling stocks to fund withdrawals means you are not forced to sell in down years. Furthermore, you are letting your winners run because you wait until you are up 20% before selling.
Sell bonds, then replace the bonds if the stock market has been doing well. Repeat for your lifetime and you have nothing to worry about.Now that’s genius.
Let’s now go through the four tasks of a good retirement investment strategy listed above and see how Mr. McClung’s new strategy outperforms the traditional financial advisor techniques.
First, it must allow for withdrawals sufficient to cover your lifestyle.
The rule of thumb for investment portfolio withdrawals in retirement is to take 4% from the account the first year and then adjust that amount for inflation each year. For example, you retire with $1 million. The first year you retire you can take $40,000 ($1,000,000 x 0.04) from your account. During that first year, say inflation was 2%. In year two, you can take $40,800, regardless of your portfolio value. That’s what is commonly referred to as the 4% rule.
The 4% rule came about because William Bengen in 1994 studied historical investment data to determine the maximum safe withdrawal rate. He found that one could safely withdraw 4% in the first year and never run out of money for a 30-year retirement.
Can the 4% ultimate safety rule cover your retirement lifestyle? That depends on the amount you have saved and the amount you will spend in retirement.
Assuming you have enough to retire, the issue with this technique is that although it is safe, is it too safe? Would you rather die with a lot of money in your portfolioor spend more and therefore enjoy your retirement more while still being safe? Optimizing the withdrawal rate can solve this dilemma.
To be clear, we still want a safe withdrawal rate, we just want to be smart about it. The 4% rule exists because you would be safe from all past market conditions using standard portfolio rebalancing. There was only one year (if you retired in 1969) where you would have been extremely close to going bankrupt.
Some years (if you had retired in the early 1930s or 1940s) you would have been able to safely withdraw over 8% per year. Withdrawing 4% when you could have safely withdrawn 8% shows that planning for the ultimate worst case may not provide us with the most enjoyable retirement.
Using Mr. McClung’s Alternate Prime harvesting method raises the safe withdrawal to 4.4% and improves on the standard rebalancing techniques in every retirement year tested.
The second task for a retirement investment system is you must keep up with inflation. Solving this issue is dependent on your asset allocation. In retirement, people want to be safe. It’s human nature to become more conservative as we age. People don’t want to risk the savings they worked their entire life for.
The real risk however is that by not putting enough of your account in stocks, you are almost guaranteeing a decrease in lifestyle later on. Without stocks, inflation will eat at your portfolio. The $40,000 you can safely withdraw from the $1 million portfolio mentioned above, will buy only half as much as today in twenty years.
The proper allocation for you can be determined, but for those people who have enough saved, an allocation to 50% stocks and 50% bonds is safe. Sixty percent stocks and 40% bonds produced the highest likelihood of not running out of money in Mr. McClung’s testing.
For task number 3, stocks must not be sold when they are down.
Selling stocks when they are down is not the best way to fund your retirement spending for two reasons. Stocks tend to trend higher and getting your account back to even requires a larger percentage gain than the loss.
After a loss, if the percentage gained is equal to the percentage lost, the account does not return to its original level. If you lose 10% and then gain 10%, you will not be back where you started.
If you start with an investment at $1000 and it goes down 10%, it’s now worth $900. If this $900 investment has a 10% gain, then it is worth $990, not the original $1000. To get back to 100 after a 10% loss, you must gain 11.1%!
This incongruence of percentages is more dramatic with larger losses. The larger the loss, the larger the subsequent gain must be just to return to the starting level.
A 20% loss requires a 25% gain to return to even. A 30% loss requires a 42.8% gain. If your loss goes to 50% (as the S&P 500 did in 2008 to 2009) you must then double your money to break even!
Taking withdrawals from stocks magnifies the losses. If you sell stocks to withdraw 4% when the stocks are down 30%, you are now down 34%. That means to get back to where you started, your account will need to gain 51% rather than 42.8%.
The fact that investment gains must be larger than the losses makes selling stocks when they are down extremely detrimental to maintaining an account of sufficient size.
This issue is overcome by Mr. McClung’s Alternate Prime Harvesting method of selling bonds to fund withdrawals. Those bonds are only replaced from the sale of stock when the stocks are up an inflation adjusted 20%. By following his rules, you only sell when stocks are up.
Money Must be Available When You Need It
By selling bonds first, you have a safe source of money available. The current performance of the stock market is irrelevant.
Actually, you can think of bonds as being a savings account of sorts. If bonds are like a savings account, how many years of savings do you feel you need to have sat in bonds?
With a 50/50 portfolio, you have 50% of your portfolio in bonds. If you withdraw 4% each year, then the portfolio contains 12.5 years of withdrawals. That sounds safe to me. Twelve years of expenses covered and sitting in safe bonds. The stock market will likely have grown in twelve years. During those twelve years, you will have replenished your bonds. So why worry about the stock market or running out of money in retirement?
There are more details to these retirement investing ideas, but I think you get the idea that it is possible to accomplish the four points of a great investing system for retirement.
If you have questions about this retirement income investing system, or other financial planning topics, please give us a call at (760) 651-6315.
A Roth IRA account is a great way to create a million dollar retirement.
Types of IRAs –
There are two main types of IRAs, atraditional IRA and a Roth IRA. The taxes on these two accounts work differently.
Contributions to a traditional IRA are tax deductible now, and taxes are paid when you take withdrawals.
Contrarily, contributions to Roth IRAs are not deductible now. You pay tax on the money before you contribute to the Roth. In exchange for paying your taxes this year, the government lets you take money out tax free when you are old enough. (A long list of rules and restrictions exist for both IRAs. The above is a simplified description.)
Choosing an IRA type –
Why choose a Roth IRA over a traditional IRA? It depends on your situation, but paying your taxes now may be beneficial. Most people imagine they will be making more money in the future.
How unsatisfactory would your retirement be if you have to live on the same amount of money you were making in your thirties? Instead, most of us plan on increasing our incomes and wealth throughout our careers.
When you will have more wealth in the future, you should choose a Roth IRA over the traditional IRA. (If your income makes you ineligible for one, consider a backdoor Roth IRA). Under this situation, you will be paying taxes at today’s income rate and then withdrawing it when you are in a higher tax bracket. Tax-free Roth IRA withdrawals will be advantageous.
IRA income and contribution limits for 2019 –
The income cut off limits for 2019 are $137,000 for single filers and $203,000 for MFJ. Each year you have earned income less than the cutoff, but greater than $6,000, you can contribute $6,000. If you are 50 or over, you can contribute an additional $1,000.
Contributing $6,000 may not sound like it could produce a large account, but adding $6,000 to the account each year adds up over time.
Account size calculations –
Let’s look at some calculations to see just how much we can save by retirement. And remember, this amount will be tax free!
$6,000/ yr
Age 30 to 67
Investment return = 0%
Value = $220,000
Without earning any interest or investment return, we would have saved $220,000 by contributing at age 30 until full retirement age of 67. Being able to save $6,000 per year, or $500 per month should be possible from age 30 and onward. If not, you need to do some budgeting work.
Now let’s change our return to a fairly conservative 5%.
$6,000/ yr
Age 30 to 67
Investment return = 5%
Value = $640,257
Wow. Over half-a-million, tax-free dollars could be yours for saving $500 per month and investing conservatively. By conservatively I mean 30% US stocks and 70% intermediate Treasuries. According to Portfoliovisualizer.com, that allocation would have been enough to produce a 5% inflation adjusted return.
Next let’s change the investment return. Since this is a long-term account, the proper investment strategy would be to invest aggressively in a high percentage of stocks. With a more aggressive 8% return, the following account values are possible.
$6,000/ yr
Age 30 to 67
Investment return = 8%
Value = $1,315,895
Check out that result! (In reality this number could actually be higher than $1.3 million because the contribution limit will not remain at $6,000 for the next 37 years. It has increased at 4% per year since 2002 when it was $3,000.)
Calculations for starting late –
What if you are not thirty anymore, but 40 years old instead? Let’s take a look at how much you could save.
$6,000/ yr
Age 40 to 67
Investment return = 8%
Value = $566,032
Or alternatively, you are now 50 years old and trying to make a big push to accumulate a nice nest egg before retiring at age 67. That gives you 17 years of contributions and a contribution limit of $7,000 because you are now eligible for the catchup contribution.
$7,000/ yr
Age 50 to 67
Investment return = 8%
Value = $255,151
That’s over a quarter of a million dollars tax-free for your retirement. If you didn’t touch that money for an additional ten years, it could be worth $550,851.
That’s a good sum of tax-free money that could be used to pay for health care, long-term care, nursing or home health care or other expenses in old age.
Conclusion –
These calculations show us that it is possible to accumulate a tax-free 1 million dollars for retirement with annual savings and investing in a Roth IRA account.
Remember, these values are only in your Roth IRA. You will also have your 401(k) and other investment accounts. It is definitely worth your effort to open a Roth IRA account, contribute the maximum each year, and invest in it aggressively.
If you would like to talk to me about this or other investing ideas, call (760) 651-6315.
Should you open a SEPIRA or SimpleIRA if you are a one-person business?
This review is for a one-person business whose owner is age 50 or over. It is NOT from the point of view of a small business with a few employees. We will look at which is the better choice under two conditions; when your self-employment income is your primary income and when it’s a secondary income. (The numbers discussed are 2019 limits.)
SEP IRA stands for simplified employee pension individual retirement account. Both the SEP IRA and SIMPLE IRA are defined contribution retirement plans. Both enable you to defer taxes until after retirement.
When investigating or thinking about these types of retirement plans, you need to remember that as a self-employed person you are both the employer and the employee.
The SEP IRA contributions come from your employer side. The SIMPLE IRA contributions are actually employee salary reduction contributions from your employee side.
In 2019, the maximum retirement contributions for the two plans if you are 50 or over are:
SEP-IRA: The lesser of 20% of compensation or $56,000.
SIMPLE: $16,000 for employee contributions plus a SIMPLE IRA employer matching contribution of 3% of compensation up to 3% of $280,000, or $8,400 maximum. Maximum total of $24,400.
Before we go into the details of each scenario, there are two possibilities where your decision is easier.
If there is a chance you will hire employees in the next couple of years, choose a SIMPLE IRA plan.
If you make less than $100,750 per year and you don’t see yourself making more than that from your self-employment income, then choose a SIMPLE IRA plan. (I used this retirement contribution calculator to arrive at the break even number of $100,750. https://www.calcxml.com/calculators/qua12 )
Which should you choose if you have another job?
In this scenario, you have another job and your self-employed income is a secondary income source. Perhaps you drive Uber or have a side business. At your main job you have a 401(k) plan and make the maximum 401(k) contribution of $25,000 every year. You want to defer taxes on as much of your secondary income as possible, to boost your retirement savings.
Remember the picture of two pockets and the fact that as a self-employed person you are both employer and employee? SEP IRA contributions come from the employer side while SIMPLE IRA contributions come from your employee side.
The maximum allowable employee salary reduction contributions are $25,000 total annually, in all such retirement plans. Your 401(k) contribution at your main job comes from this employee side and therefore, you cannot contribute to a SIMPLE IRA if you are already contributing $25,000 to a 401(k).
Since SEP IRA contributions come from the employer side, you could contribute the $25,000 to your 401(k) and also 20% of your self-employed income to your SEP IRA plan.
So, if your self-employed income is a secondary income, you should open a SEP IRA.
What if your self-employed income is your main income?
Since either the SEP IRA or SIMPLE IRA will be your main retirement plan, the decision will come down to which plan has a higher contribution limit.
If you make less than the break even number ($100,750) discussed above, say $50,000 for example, then your maximum contributions to a SEP IRA would be $10,000 and to a SIMPLE IRA would be $17,500. You should choose the SIMPLE IRA because you would be able to save an additional $7,500 tax deferred.
If you make more than the break even point, such as $120,000, then the maximum contribution to a SEP IRA is $24,000 and to a SIMPLE IRA is $19,600. You should choose the SEP IRA.
Is there a significant difference in annual maintenance or IRS reporting requirements?
No. Neither plan requires any reporting to the IRS. The custodian where your accounts are held will take care of all the required paperwork when you open either IRA account.
Impact on Traditional and Roth IRA contributions.
With both the SEP IRA and SIMPLE IRAs, you are still eligible to own and contribute to a Traditional IRA or a Roth IRA. That means you still have the opportunity to contribute another $7,000 for retirement, regardless of which plan you choose.
The 2018 tax write-off decision factor.
The month of the year when you are making this decision may sway you. You can open a new SEP IRA anytime up until you pay your taxes in the following year. So, as I am writing this in February of 2019, you still have until April 17, 2019 to open a new SEP IRA, make contributions for 2018, and therefore get the tax deduction on your 2018 tax return.
The deadline for opening a SIMPLE IRA for 2018 passed on October 1, 2018. You can no longer open a SIMPLE IRA and use it to reduce your 2018 taxes due. If you open a SIMPLE IRA today, the contributions you make will be for 2019.
If you are making this decision or another decision about your retirement plan and would like our help, call us at (760) 651-6315 or email contactus@andrewmarshallfinancial.com.