I wrote this blog post to help those of you who are reaching retirement age and own a lot of individual stocks in your brokerage account, and you are not sure what to do with them.
Not knowing what to do, not having a strategy, can be paralyzing and you may be unable to sell anything or move your accounts. You are likely worried about the capital gains taxes you will trigger if you sell those stocks.
People usually end up owning a lot of individual stocks in two situations. The first is a DIY investor who has bought individual stocks over the years and never sold any.
I recently met with a gentleman who listened to the Motley Fool podcast and subscribed to their newsletter for the past 20 years. When the Motley Fool service recommended a stock, he bought it. Now he is looking to retire next year, and he has a portfolio of over 100 individual stocks.
The other situation where someone might end up with lots of stocks in their brokerage account is someone with an AUM financial advisor. An AUM advisor is someone who charges a percentage of the account to manage it. They often buy and sell individual stocks to make it look like they are doing something worthy of the high fees they charge.
I talked with a woman last month who was in this situation. Her accounts are at Morgan Stanley, and she is paying her current advisor over $40,000 per year to manage her accounts. (1% of $4 million is $40,000.) She would like to move the account to Schwab and manage it herself, saving herself $40,000/year in retirement.
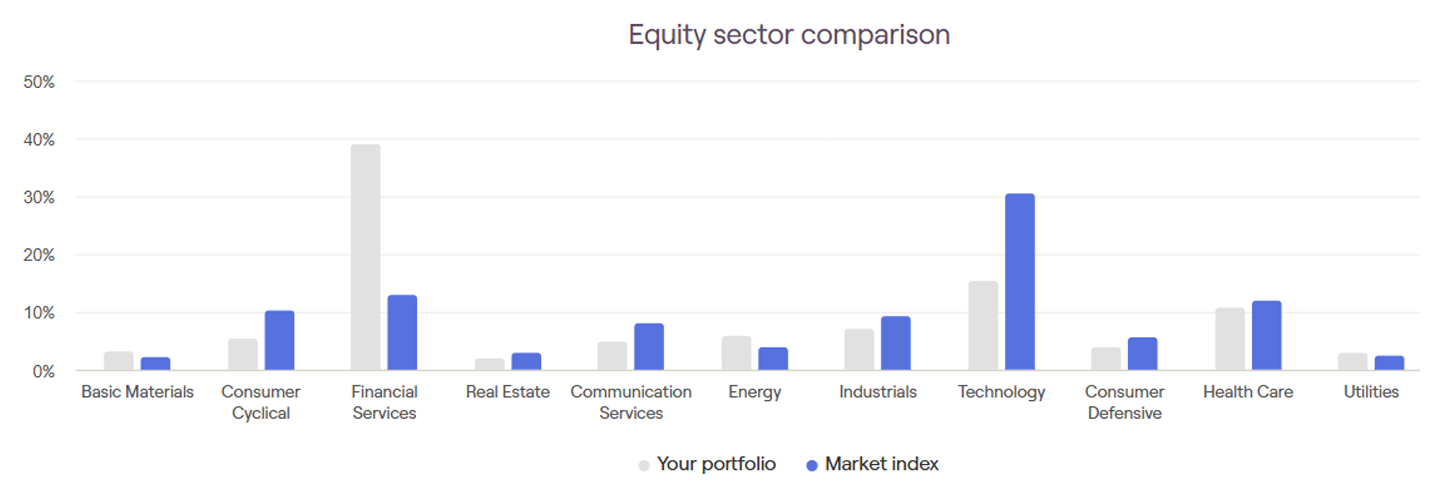
The list of stocks on the right is from her account. You can see she owns many of the same companies that are in the index (Apple, Amazon ,Google, etc.).
Looking at your own portfolio with all these individual stocks may stop you from taking control of your own account because it looks complicated.
Your Own Personal ETF Concept
In a brokerage account with many stocks, you have essentially created your own personal ETF. If you think about your account with many stocks as a whole, it is like an ETF where you can see all the current holdings.
What is an index fund? An index fund owns a sampling of the market that targets certain characteristics. It may be the largest 500 stocks, it may be value stocks, small-caps, or many other characteristics.
As an hourly financial planner, I have software that I can enter your holdings into, and it enables me to compare your basket of stocks to the index. The following graphic shows a client’s portfolio.
You can see he owns more bank stocks and therefore fewer tech and other stocks than the index.
Self-management In Retirement
If you want to self-manage an account like this in retirement, you do not need to actively trade this account like your financial advisor was doing.
Index funds do not trade their holdings daily. They are rebalanced quarterly. I think adjusting your holdings quarterly is not even necessary. Making a selling priority list once per year is enough.
As a retiree, you will be withdrawing from your account by selling off stocks most years. You can sell off whichever stocks will move your account towards matching the index. In other words, sell the stocks that are most out of line with the index, as needed.
The goal for my client I mentioned above would be to prioritize selling enough bank stocks to cover his living expenses in the coming years plus a bit extra to use to buy a technology ETF. That way, over time, he moves towards matching the index. Also, his portfolio gets simplified as he sells individual stocks.
He doesn’t need to sell all at once to match the index immediately because the stocks he owns are good, quality companies.
The situation of owning a long list of individual stocks is really not as complicated as it first appears.
If you are someone who owns many individual stocks, then I hope the concept of you owning your own personal ETF, will help you realize that you can manage your own account in retirement. Contact me if you would like help getting started.
This is a written summary of a video I posted on YouTube.
Introduction
Recently, I worked with a client couple who were considering using Schwab Intelligent Portfolios, a Robo-advisor, for managing their retirement funds. This got me wondering whether using a Robo-advisor or all-in-one self-rebalancing fund is indeed the best strategy for retirees, or if a more traditional approach of managing stocks and bonds separately would yield better results.
In this article, we’ll explore both these options in the context of a retirement withdrawal account and examine which one proves more beneficial.
Robo-Advisors vs. Traditional Portfolio Management
In this study I wanted to compare automatically rebalanced solutions. This includes robo-advisors and mutual funds or ETFs that rebalance automatically. Examples of such funds include target-date funds, Vanguard Life Cycle funds, balanced funds, income funds, Vanguard Wellington and Wellesley funds, and others.
What Are Robo-Advisors?
Robo-advisors like Schwab Intelligent Portfolios are automated platforms that manage your investment portfolio using algorithms. They automatically rebalance your portfolio to maintain a set asset allocation, which can relieve investors from the day-to-day management of their investments.
Traditional Portfolio Management
In contrast, traditional portfolio management involves manually balancing your investments, where you maintain separate holdings for stocks and bonds. This allows the investor to decide which assets to sell based on market conditions, giving them more control over their outcomes.
The Case Study
To determine which strategy works better for retirees, I conducted a case study using two different 5-year periods.
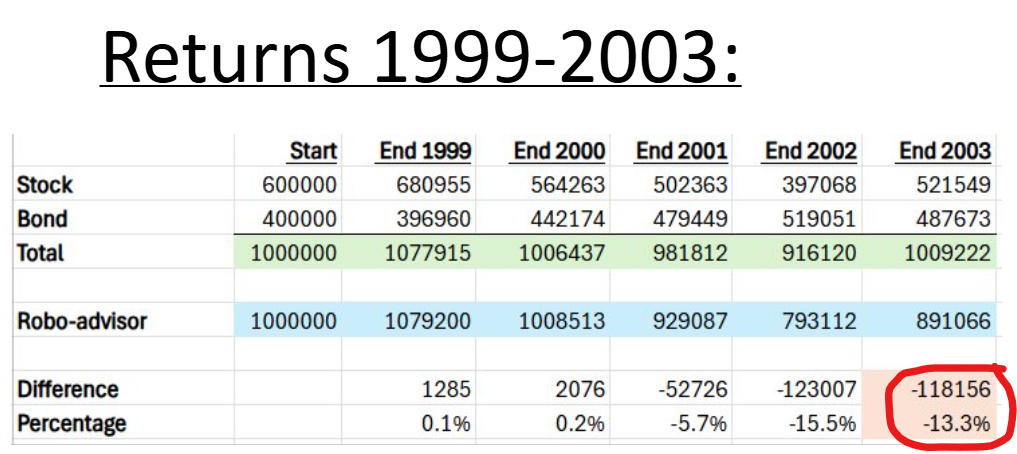
1999 to 2003 – this included the dot-com bubble.
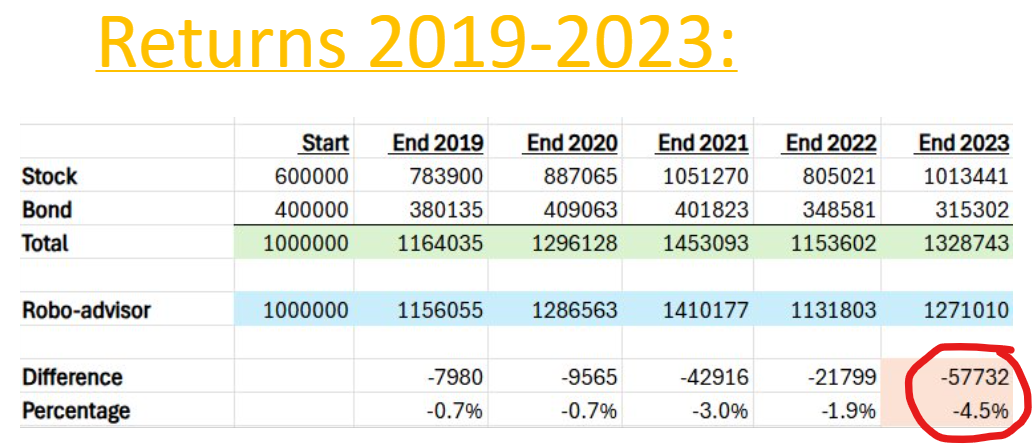
2019 to 2023 – this timeframe included the COVID-19 crash and subsequent recovery, followed by the 2022 bear market.
Methodology
– The portfolio starts with $1 million. – $50,000 is withdrawn each January.
Here are the selling rules which made keeping stocks and bonds separate the better technique. – Withdraw from stocks if the previous year’s returns are positive. – Withdraw from bonds if the previous year’s returns are negative.
I used Portfolio Visualizer to determine the portfolio returns. Its new interface is somewhat confusing, so I used the Legacy User Interface to conduct my analysis.
For the traditional management account, I used:
– Vanguard Total Stock Market Fund (VTSMX) – Vanguard Total Bond Market Fund (VBMFX)
For the Robo-advisor / All-in-one setup, I assumed a fixed 60/40 stock-to-bond ratio of the two funds. I had the portfolio set to rebalance monthly to approximate the auto-rebalancing of the robo or funds.
Analysis and Results
1999 to 2003 (Dot-Com Bubble)
– Withdrawals were made from stocks in 1999 and 2000. – Withdrawals from bonds in all other years.
While the difference here is less pronounced compared to the first period (only a 4.5% difference), the self-managed portfolio still outperformed the Robo-advisor / All-in-one Fund. This outcome suggests that during periods of strong stock market performance, self-managing your investments can contribute to better financial outcomes, but the real advantage occurs when the market is down.
Implications for Retirees
Self-managing your investments can really pay off during times when the stock market is down. By selling bonds to generate cash in down stock market years, the stock portion can recover faster, which leads to larger portfolio balances.
I understand self-managing your investments takes some time and effort, but one option that would limit the time needed, is to self-manage your first priority withdrawal account and use an all-in-one fund or robo-advisor to manage your other accounts.
To set up a free-first meeting with Andrew please CLICK HERE.
I have had a few new clients recently tell me they do not understand bonds and therefore have not invested in them. They are currently invested in money market funds or CDs, instead of bonds. This post should explain how bonds work and why investing in them is a good idea.
Basically, a bond is an IOU. Government entities or companies issue bonds. The purchaser gives the government entity or company some money in exchange for interest payments over a set number of years into the future and once that set time is up, the issuer returns the original principal.
In order for the issuer to attract someone to buy the bond (to give them money in exchange for an IOU), they must offer an interest rate that is competitive with other investments the investor could put their money in.
When the original purchaser buys the bond, they get the interest payments at the original offered percentage. Bonds can be bought and sold after the original purchase. The original interest payment amount transfers with a bond that is purchased after the original issue.
For example, a $1,000 bond offered originally at 5% would make payments each year of $50, regardless of if the original buyer later sold it.
Now let’s say interest rates have dropped (as might be the case in 2024). The offering company or government no longer needs to offer a bond at 5% to be competitive. Let’s say they can now offer 4% and still have enough buyers that they will sell all the bonds they offer.
The new bonds cost $1,000 and pay $40 per year. The people who bought the old bonds are happy because they will continue to receive their $50 per year. But what if they wanted to sell? Is their bond worth the $1,000 they paid for it? Or more? Or less?
Well, lots of buyers would prefer to pay $1,000 for a bond that pays 5% ($50/year) than to pay the same amount for a new bond that pays 4% ($40/year).
To make the percentage payout equal, the old bond should be worth more. A bond purchased for $1,250 that pays $50 has a payout percentage of 4%. The same percentage as a new $1,000 bond that pays $40. (In reality, bond pricing is more complicated than this.)
This shows the characteristic of bonds where the price goes in the opposite direction to the interest rate. The interest rate went down from 5% to 4%, but the price or value of bonds for sale on the open market went up. To keep this idea straight in my head, I always think through the thought process of a purchaser.
Bond values are expected to increase within the next 12 months when the Federal Reserve lowers interest rates. The people who already own bonds will continue to receive larger payments and the value of their bonds will go up. Therefore, it should be a good strategy to buy bonds now, before the interest rates drop.
Bond funds
Bond funds, either mutual funds or ETFs, are a combination of a lot of bonds. Usually thousands of bonds. They are issued by different entities, mature at different times, and have different interest rates on them. The fund manager buys and sells bonds to keep the fund’s characteristics at the desired values.
The desired values include statistics such as average time to maturity, type of issuer, taxable or tax-free, duration (which measures how sensitive the bond price is to interest rate changes), and others.
Types of Bonds
Bonds are offered at various interest rates, depending on the quality of the issuer. It makes sense that the Apple Corporation can attract investors without paying as high an interest rate as a less secure company such as Bed Bath and Beyond. There is always a risk that the issuer of the bond will not be around at the end of the bond’s term. The end of the term is called maturity. When a bond matures, the person who owns the bond receives their principal back, assuming the issuer has the money to pay them back.
Due to the quality of the issuer, there are different bond ratings. Investment grade is the highest level, and below a cutoff point, bonds are considered “high yield” or “junk” bonds. The “high yield” term makes sense because these companies must offer a higher yield to entice buyers since their bonds are at a higher risk of defaulting and not paying back the principal at maturity or making the payments along the way.
I don’t think retirees should be investing in high-yield bonds. Retirees should be investing in safe bonds from highly rated issuers, including the US government, so their money is available when needed to pay for living expenses.
There are ETFs and mutual funds that have sliced up the bond market in all sorts of ways. This allows an investor to purchase a fund with almost any desired characteristics.
The first strategy for saving on your taxes in 2023 is harvesting capital gains in your brokerage accounts. Income taxes for the year are calculated by totaling all incomes (regardless of type), subtracting deductions, and then splitting your income into capital gains and other income types.
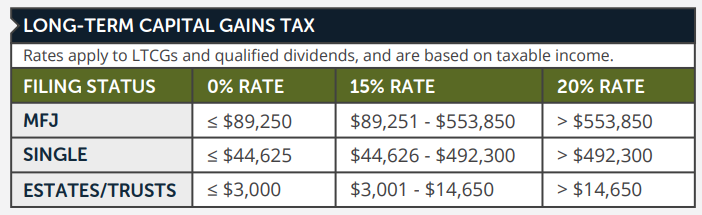
Capital gains tax rates use a different set of brackets from the ordinary income tax brackets. The following diagram shows the brackets for capital gains rates in 2023. The rates are 0%, 15%, and 20%.
If you are married filing jointly and your taxable income will be less than $89,250 in 2023, you will pay 0% on capital gains! The cutoff for singles is $44,625.
People at this income level are usually retired with no pension income and currently living off savings or investment income while waiting to claim Social Security.
If you fit this category and you plan to sell your investments for spending at some point during your lifetime, then harvesting the gains in years when you will pay no tax is a smart move. You can take some future tax liability off the table.
Since you are selling at a gain, you can buy the investment back once the sale clears and you have cash available in your account to trade. Your new cost basis will be higher.
If you never plan to sell these shares and instead pass them on to an heir or a charity, then there is no need to harvest the gains because those two recipients will not pay taxes on the gains. Heirs will get a step-up in basis and charities don’t pay taxes.
To implement this strategy correctly, and not end up paying tax, you need to predict what your taxable income will be for the year, so you can be sure the amount you sell will keep you under the 0% limit. This month, mutual fund companies release the expected per share dividend and capital gains they will pay out. You can find their estimates on their websites.
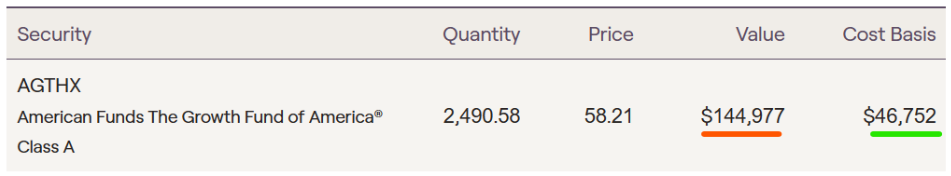
As an example, the following diagram shows a client’s portfolio holding in the Growth Fund of America. They have $98,225 of gains. They won’t be able to harvest all those gains in 2023, but they can harvest some and increase their cost basis for future sales above the current $46,752.
Harvest Tax Losses to Offset Capital Gains
If your income is too high to harvest any tax-free capital gains, you can still look through your brokerage accounts and possibly find opportunities for tax savings.
With last year’s market drops and this year’s mixed returns, you may have some losses in your accounts in either stock or bond funds. Recently, I have seen a surprising number of client positions that are at a loss.
By selling offsetting gains and losses, you will be able to eliminate some future gains while having no current taxes due.
Selling at a loss does make you susceptible to an IRS rule called the wash sale rule. This rule was put in place to stop people from taking losses and immediately buying back the same investment.
When you sell an investment at a loss, you or your spouse cannot buy it or a “substantially identical” stock or fund within the next 30 days. The easiest way to abide by the rule is to wait until the 31st day to buy the same investment back, but this leaves you open to missing a big move that could occur in the next month.
Another way to avoid breaking the rule is to buy something different. (The IRS has never defined the term “substantially identical”, but a fund from a different company or different asset class will suffice.)
A straightforward example of this would be someone whose portfolio is overweight in US stocks. This could be an opportunity to sell offsetting gains and losses and rebalance into some international or emerging market stocks.
After adding up the losses and gains of the trades you place, you are allowed to write off $3,000 of losses, but beyond a $3,000 loss, you must carry over the difference to your 2024 return.
Do you want objective financial advice? Are you comfortable managing your own investments at Fidelity, Schwab, Vanguard, or others? Then you should consider hiring an hourly financial advisor when you need advice.
Finding a financial advisor or a financial planner who will charge solely by the hour for their time spent is not an easy search.
There are many advisors who will tell you they will charge by the hour when you first meet them, but really, they prefer to charge based on the size of your investment accounts. This is called AUM fees or assets under management.
I have heard from clients that they spent a lot of time searching for an hourly advisor and thought they had found one, only to later find out the advisor really wanted them to sign over control of their investments.
Where do you find an hourly financial advisor? On the internet at one of the following websites.
My first suggestion for where to look to find hourly financial advice is the Garrett Planning Network. The Garrett Planning Network was founded with the intent of providing competent advice to people who do not meet the usual qualifications advisors look for. (That generally means a large investment account that can be managed for ongoing AUM fees.) I am a proud member of the Garrett Planning Network.
If you go to the Garrett website, click in the top right, and scroll down to hourly only, you can see a list of advisors nationwide who do not charge or offer AUM. Choosing one of these advisors means there is no way they will later ask you to hand over control of your accounts.
Another website directory of advisors who might charge by the hour is NAPFA. I used to be a member of NAPFA and my impression is that a very high percentage, like far above 90% percent, charge AUM fees. They are fee only, which means they will not charge you commissions, but very few charge solely by the hour.
On the NAPFA website you can narrow down your local search results using the funnel icon to select Hourly.
The same thing goes for the next directory. The Fee Only Network. The advisors on this site mostly charge AUM fees, but some do not. You will have to read through the descriptions or go to the advisor’s individual website to read about how they charge.
The 4th referral site is the XY Planning Network. On their site you can narrow things down to eliminate the AUM advisors by clicking on “Select Advisor Specialties” and then “Advice Only”.
“Advice Only” is a newer term that has become more popular in the past couple of years and includes hourly financial advisors but could also mean subscription or retainer types of fees.
A website directory for these planners is the Advice-Only Network.
This website does not yet have a good search function to narrow down or sort the list of advisors. You will have to scroll through the advisors and read about each one to find someone you like.
I think hourly financial advice is best for someone who is knowledgeable about personal finance concepts but would like to check in with a professional to make sure they are doing things correctly, have a question that is more complicated than they can find an answer to online, or want a second opinion.
All my clients have been managing their own investments and have no desire to hand over those management duties. They also realize there may be things they don’t know that are costing them money, especially in the long run. Paying an advisor an hourly fee to look things over and make recommendations on how to improve upon what they have been doing is money well spent.
To schedule a free first meeting with me, click here.
The definition of tax efficient withdrawals in retirement means correctly managing which account type your investments are in, when to pull from these accounts, and whether you should convert some of your tax-deferred accounts to Roth IRAs to reduce your overall tax burden.
Making tax efficient withdrawals after you have retired comes down to the differences between how each account type is taxed. Here are the 3 account types in terms of tax treatments.
A taxable account – This includes bank accounts and brokerage accounts. With these taxable accounts, you pay taxes every year on the dividends and capital gains produced by the holdings, even if you don’t actually sell anything in the account. If you own mutual funds or ETFs, the fund manager is buying and selling shares to adjust the fund’s holdings. You are taxed when the manager sells a stock for a gain. You are also taxed when a stock within a fund pays out their quarterly or annual dividend. If you earn any interest on a bank account, you are taxed each year.
The second account type is tax-deferred accounts like 401(k)s and IRAs. These accounts are only taxed when you take your money out. You are taxed at whatever your tax rate is at that time. Unlike the brokerage account, you do not pay taxes each and every year. When a capital gain or dividend is paid out from a mutual fund or ETF, you can reinvest 100% of the payout into buying additional shares rather than into paying taxes.
Roth IRAs – These accounts are the most tax-efficient. You pay taxes up front, before contributing to these account types, and you (or your heirs) never pay taxes again. There are no ongoing annual taxes like a brokerage account and there are no taxes upon withdrawing like a traditional IRA or 401(k).
Each of these account types has their own set of rules. By using the rules wisely, you can optimize how much of your money you keep and reduce the amount you give to the government.
Creating a strategy that follows the rules correctly and maximizes your money requires some expertise. To talk with us about your situation, please schedule a free, first meeting using this link.
As you investigate financial advisors and the various methods financial advisors and financial planners use to charge for their services, you should become aware of the benefits of using an hourly, fee-only financial planner.
There are two big conflicts of interest in financial advice. The first is assets under management fees or A.U.M. fees for short. The conflict of interest in this type of fee comes from the fact the advisor earns more money from you when the account they manage is bigger. At first this may sound like a great motivation for the advisor to invest your money well, but there are times when it can be detrimental to your financial well-being, in addition to being very expensive when you actually calculate the fee.
A few examples include the financial advisor investing your account at too high a risk level. They do this in an effort to grow the account, but in a down market, the losses you experience could be very stressful for you.
They may discourage you from investing in rental real estate, even if it is a good investment. Also, they may not suggest funding a 529 plan with an up-front lump-sum amount taken from your investment account because it would lower their ongoing fees.
The second serious conflict of interest in financial services is selling insurance and insurance products like annuities for commissions. Obviously, it is difficult to trust someone who benefits financially from the sale of a product they are recommending.
At Andrew Marshall Financial, LLC we are hourly and fee-only financial planners. We do not offer AUM services and we do not sell insurance products.
By doing business this way, we avoid the two main conflicts of interest I just described. I invite you to schedule a free, first meeting to see if our services would be a good fit with your current needs.
You’ve probably heard or read that you should wait until age 70 before claiming Social Security. In this blog, I’m going to show you actual numbers, so that you can see just how much of a difference delaying Social Security can make.
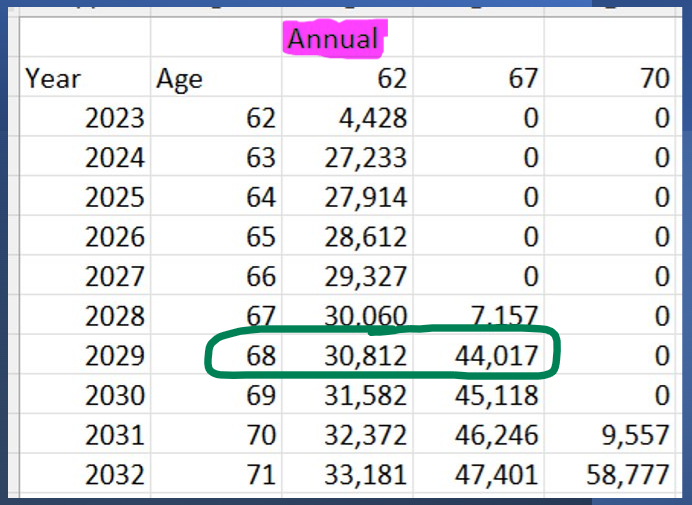
The details of our scenario are Diane is turning 62 in November and retiring. She is single and has never been married. This keeps the scenario simple because there are no spousal benefits involved. Her Social Security full retirement age benefit is $3,163 per month at age 67. To get that large of a Social Security benefit means that she has been a high-income earner for many years. I am going to show you how much she will receive if she claims at age 62, 67, and 70.
The following spreadsheet shows the annual amounts under different claiming ages.
If she claims at 62, in her first full year of benefits she will receive $27,233. That amount with cost-of-living increases (which are assumed to be 3% per year) increases to become $30,812 per year by age 68.
If she delayed claiming to 67, instead of receiving $30,812, she would receive $44,017 that same year.
That’s a big difference!
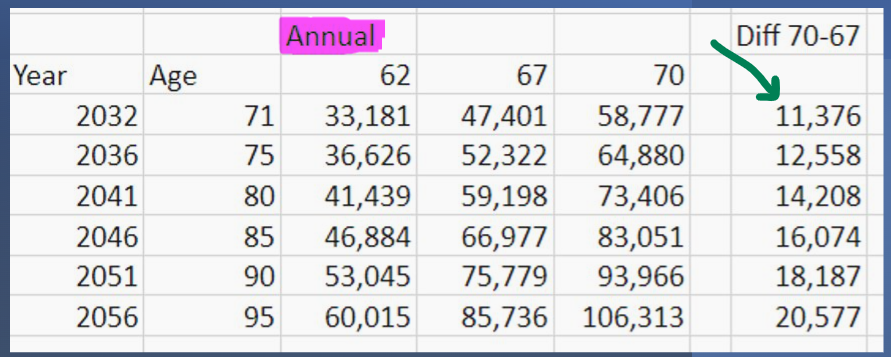
Continue down to the bottom row and look at the year she turns 71.
If she claims that 62, she’ll be receiving $33,181 per year. If she claimed that 67, she would receive $47,401 per year while claiming at 70, she would receive $58,777 per year. That’s a significant difference!
Can she afford to wait?
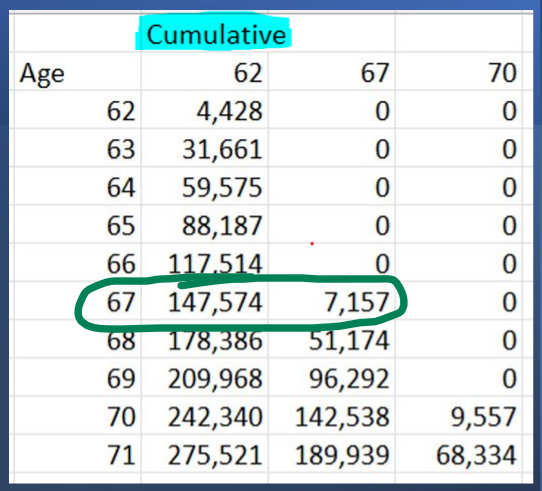
If Diane is going to wait until age 67 to claim Social Security, she must have money set aside or other income to live on. This next spreadsheet shows that she would have received $140,000 by the time she is 67. This was calculated by adding up the benefits received each year.
If she does not have a way to pay $140,000 of bills, then waiting is not even an option. She has to claim early.
If she does have money set aside in a bank account or in a brokerage account, then she can afford to wait to claim her Social Security. Most often the breakeven point comes around age 79 years’ old.
So, if Diane is going to live past age 79, she should delay her Social Security benefits.
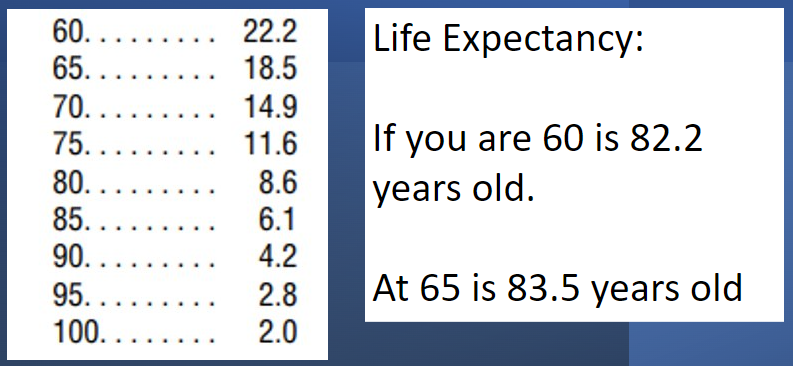
Life Expectancy
If age 79 sounds like old age that you’re unlikely to reach, well life expectancy tells us that half the population who are currently 60 are going to live past age 82.2. The odds of living into your 80s are even better if you’re already 65.
Cost of Living Adjustment (COLA)
Another thing I want to point out about Social Security benefits and the advantage of waiting to claim is that the difference increases each year as you can see on the right-hand column of the following spreadsheet. The reason the benefit difference increases each year is that Social Security gives a COLA. A cost-of-living increase that’s a percentage amount.
A 3% increase on $58,000 is larger than the 3% increase on $47,000. Over time the COLA increase compounds, so that the difference is increasing for each year that you stay alive.
If we look at the age 90 row, we can really see how big of a difference waiting to claim Social Security makes if one lives a long life.
In this example, claiming at the various ages would be $53,045 versus $75,779 versus $93,966. That’s a really big difference!
Let’s go through the name of this ETF and see what each of the parts means.
Invesco is a large investment company which manages this fund. They manage $1.4 trillion dollars in all their funds combined.
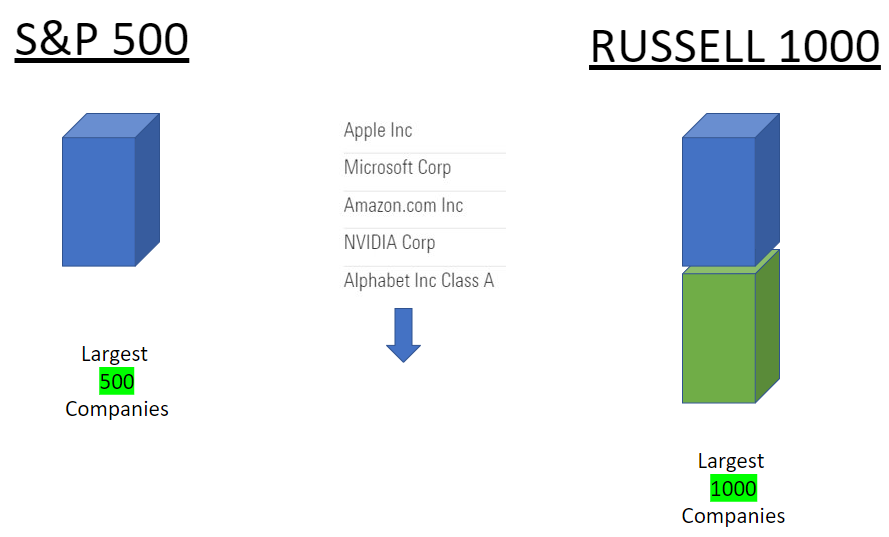
Russell 1000 is a stock index. You’ve probably heard of the S&P 500 Index. Well, the Russell 1000 index covers the same 500 stocks as the S&P 500 plus the next 500 largest stocks.
Dynamic means that the holdings in this fund change according to predetermined triggers. With a standard index fund such as the S&P 500, the holdings change infrequently. OMFL on the other hand is reconstituted and rebalanced monthly based on various economic indicators.
The way this works is that each of the 1000 securities are assigned a multi-factor score for each of five investment styles. Those styles are value, momentum, quality, low volatility, and size.
Depending on which stage of the economic cycle we are in, the fund overweight’s two or three of the five factors.
The bottom of this diagram shows that in an economic recovery phase the fund would emphasize size and value. When the economy moves into an expansion phase, the fund would add stocks that ranked high in the momentum score along with size and value.
Where we are now, in an economic slowdown, the fund should be invested in companies that scored high in quality and low -volatility.
Using PortfolioVisualizer.com, we can check and see how this OMFL fund has compared in performance to the iShares Russell 1000 ETF (symbol IWB), which is a standard Russell 1000 ETF.
This result is showing from 2018 until March 2023. Ten thousand dollars invested in January 2018 would now be worth almost $19,000 if it was invested in OMFL and $16,000 if it was invested in the standard Russell 1000 Index fund. That’s a big difference! 3.7% annually.
The standard deviation was higher, but the best year was larger than the standard index. The worst year it lost less, and the max drawdown was less.
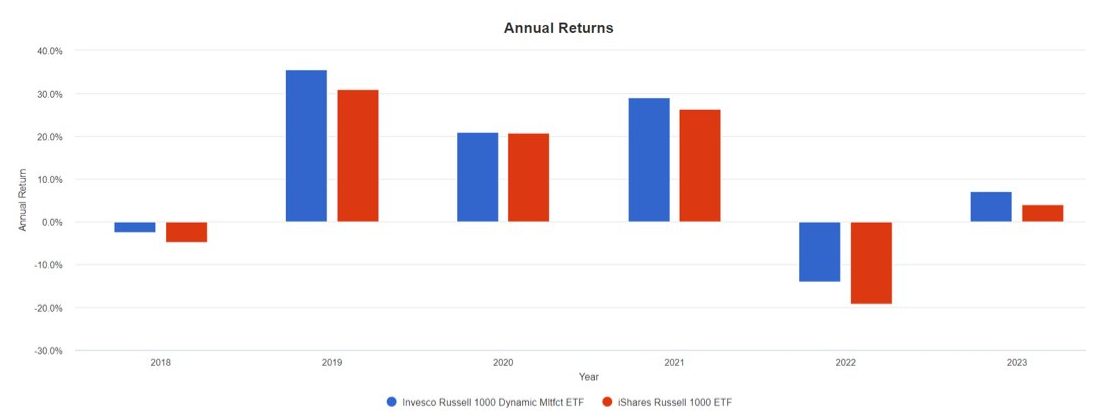
This next diagram shows annual returns by year. The blue bars are the OMFL fund, and the red bars are the standard fund.
You can see that in every single year the blue bar is better than the red bar.
In 2018 there was a trade war with China and the stock market was negative for the year. OMFL lost less that year than the index. (OMFL: -2.57%, IWB: -4.88%)
In 2019 the economy was growing quickly, and the stock market did very well. OMFL did even better. (OMFL: 35.58%, IWB: 31.06%)
In 2020 Covid shut down the world economy. In one year, we went from growth to recession and back to growth when the government stimulated the economy. In 2020 OMFL did slightly better than the standard index fund. (OMFL: 20.96%, IWB: 20.77%)
In 2021, a growth year, OMFL beat the Russell 1000 again. (OMFL: 28.96%, IWB: 26.32%)
Last year the index was down big. OMFL lost less. (OMFL: -13.97, IWB: -19.19%)
So far this year in 2023, OMFL has beaten the index again. (OMFL: 7.13%, IWB: 4.1%)
OMFL has been in existence for more than five years and it has beaten the index in every stage of the economic cycle. I think that’s really impressive, and it shows that the rules that govern this fund’s reconstitution are effective.
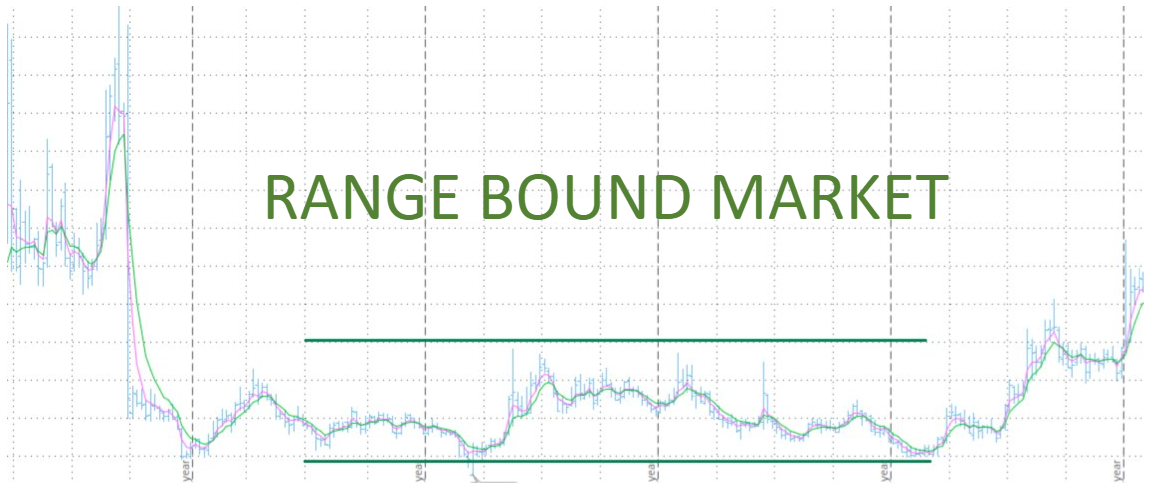
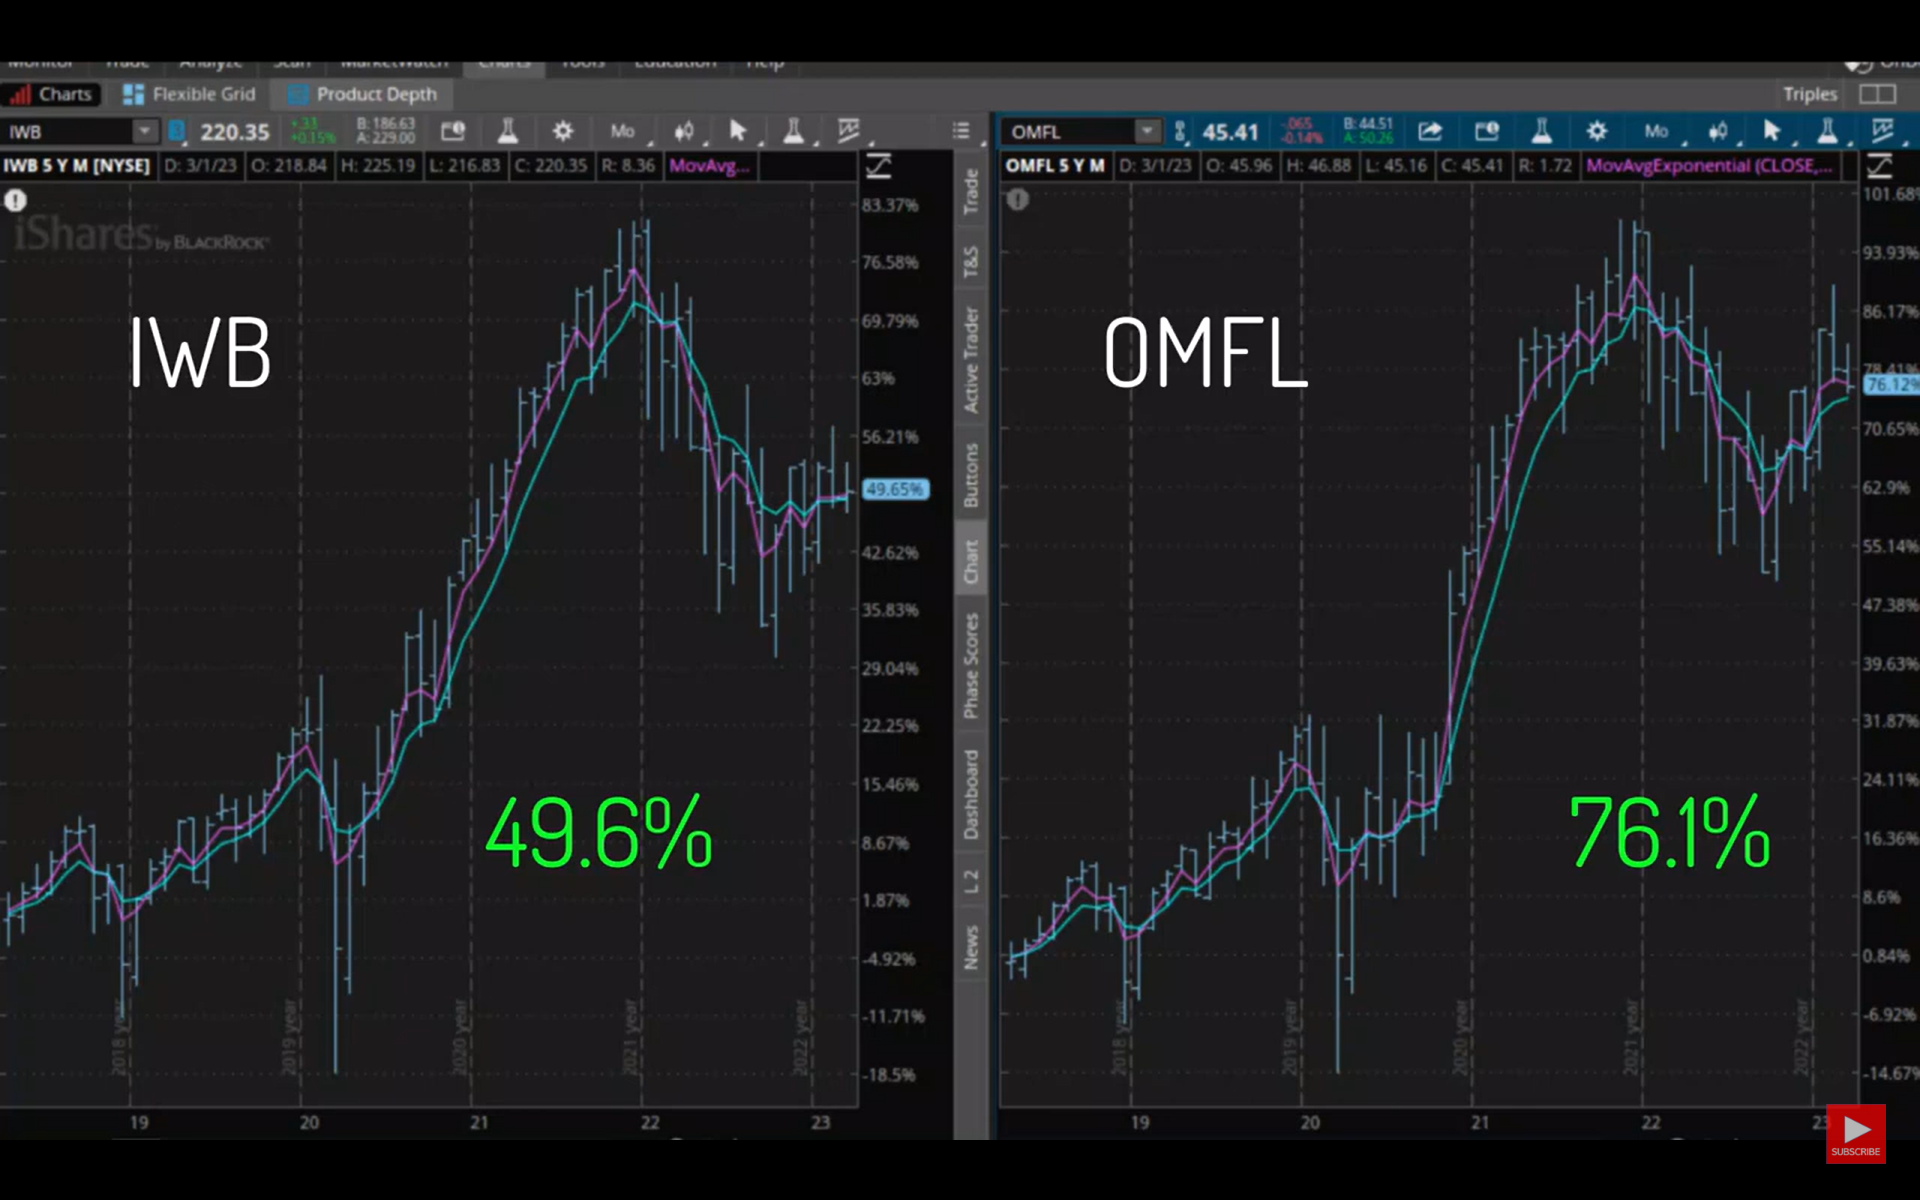
One thing we haven’t seen is how OMFL performs in range-bound markets. A range bound stock market is one that oscillates between a high and low for months at a time without really moving higher or lower.
The stock market has been trending up or down in the last five years. In these two stock charts, we are seeing the iShares Russell 1000 Index Fund (IWB) on the left and OMFL on the right. They both are showing five years’ worth of returns.
IWB on the left is up 49.65%. OMFL, in the exact same amount of time, is up 76.12%. That is a big difference.
If you are looking to invest in a fund that has a good chance of performing better than a standard index fund, then I think you should consider researching this Invesco Russell 1000 Dynamic multi-factor fund symbol OMFL further.
Remember that just because this fund has outperformed the index in the past, does not mean this fund is guaranteed to outperform the index in the future.
Also, this is not a recommendation to buy this fund. This is not personalized financial advice.
It is important to understand that just because the stock market has done very well in recent memory (2022 excluded), does not mean that will always be the case. It can be easy to assume that stocks always go up faster than everything else. However, it is entirely possible that 2022 turns out to be similar to 2000 and the next 12 years parallel 2000 to 2012.
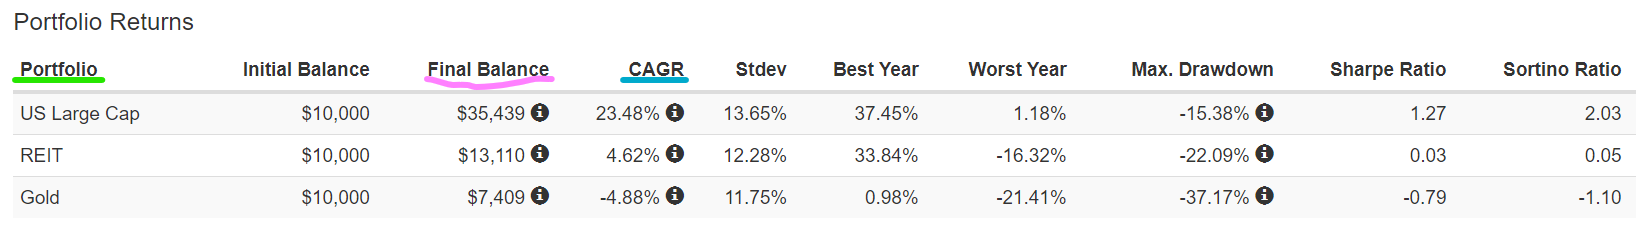
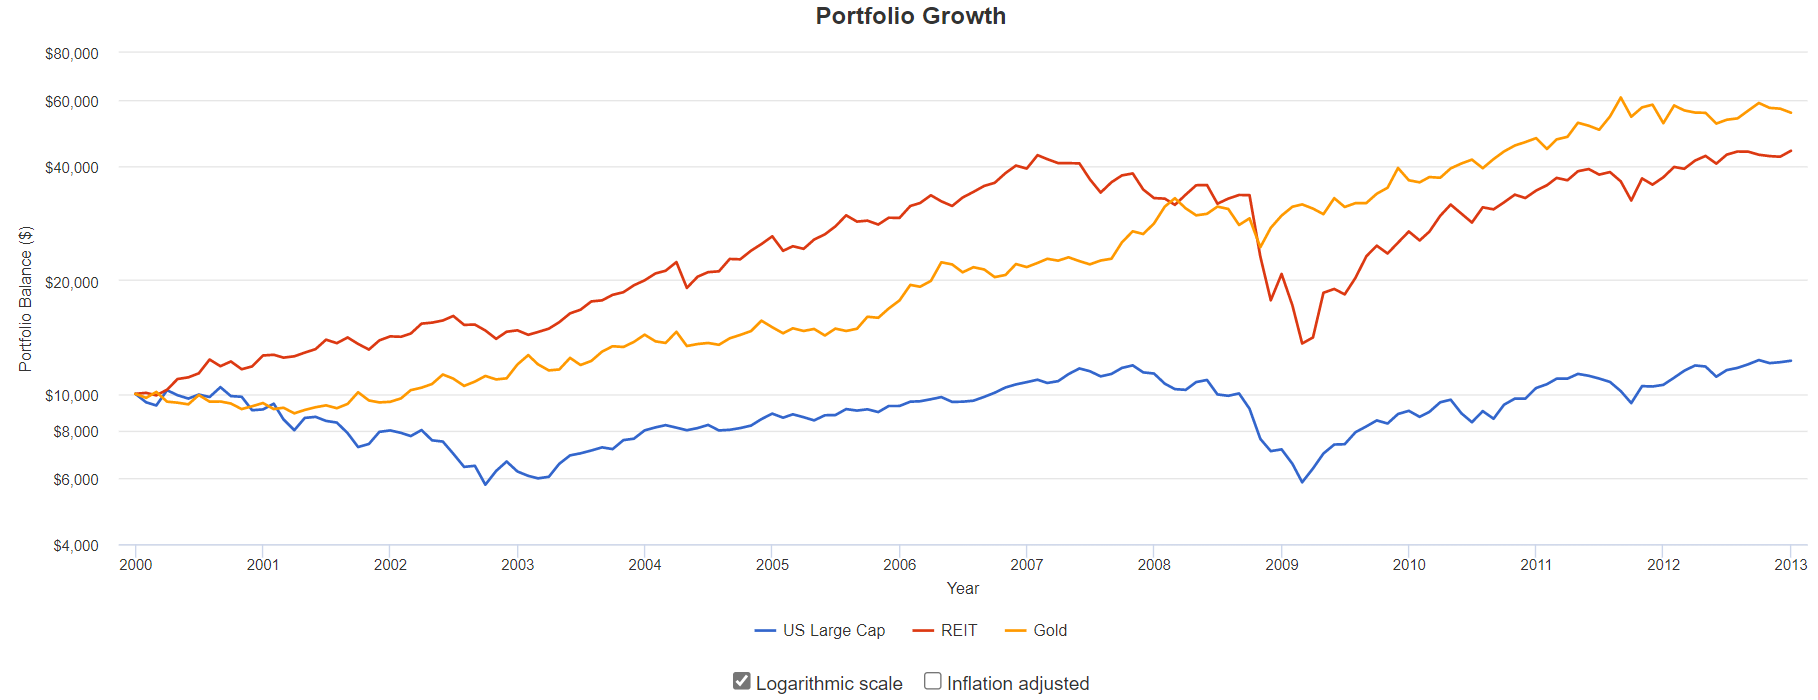
The following graph shows the performance of three asset classes from 1994 through the end of 1999. They are large cap stocks (such as the S&P 500), real estate, and gold. The blue line shows stock returns, the red line shows real estate and gold is the yellow line.
By December 1999, $10,000 invested in stocks in January 1994 would have turned into $35,439. A $10,000 investment in real estate investment trusts would be worth $13,110 and $10,000 invested in gold would have gone down in value and would have been worth $7,409.
Someone investing additional money at the start of 2000 probably would have felt that the best investment was the stock market. After all, investors more than tripled their money in stocks over the previous six years. It would have felt like the stock market was bound to continue going higher and investing in gold or real estate was sure to limit their investment portfolio returns.
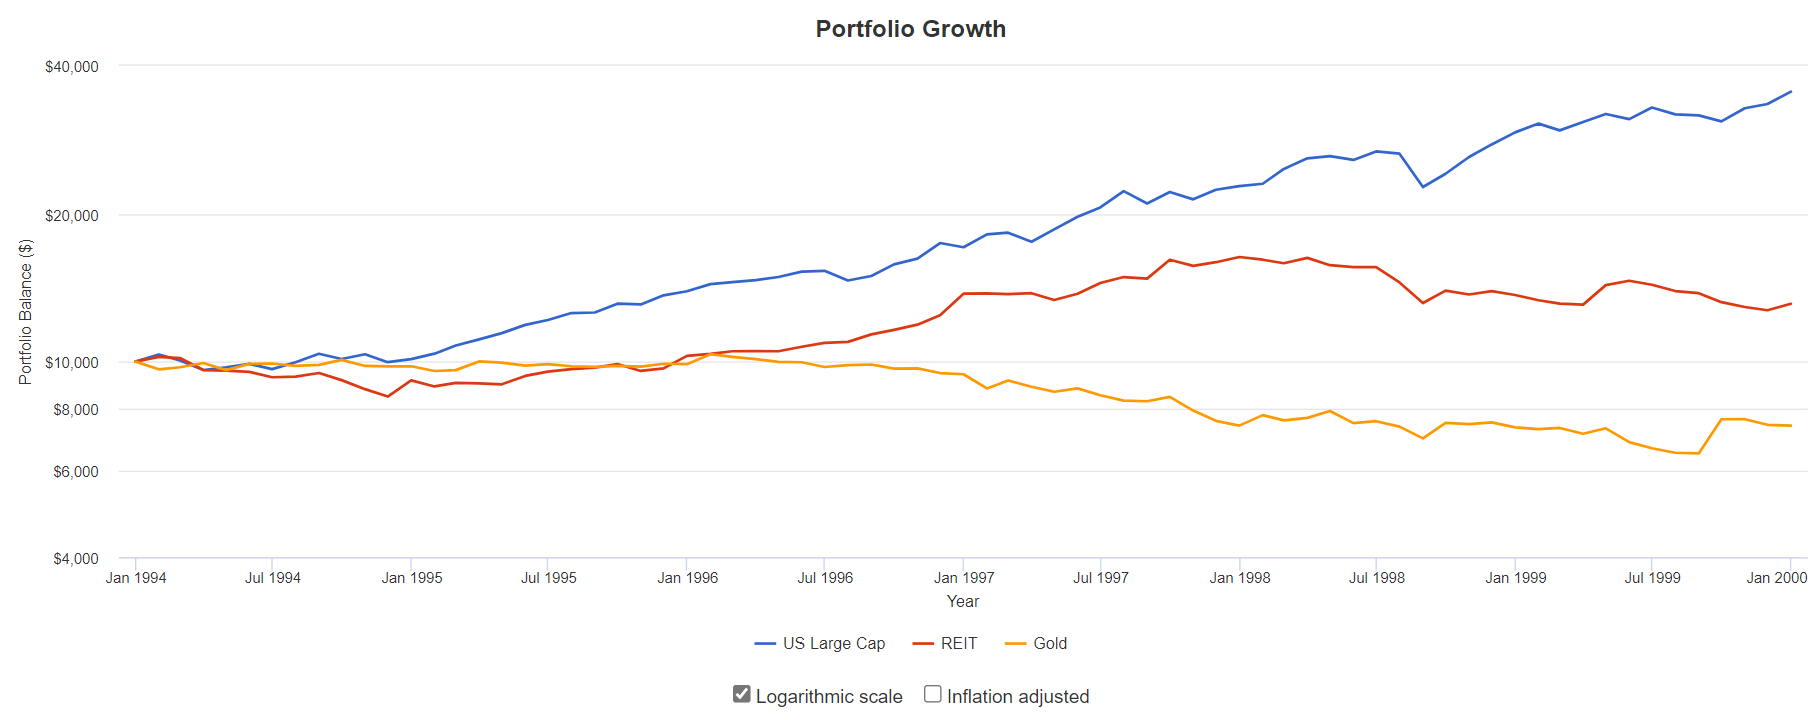
The next graphic shows what actually happened over the following 13 years. The blue line again is stocks, the red line is real estate and gold is the yellow line.
Stocks ended the thirteen years from 2000 through the end of 2012 with an average annual return of only 1.56%. There were many years (September 2000 to September 2006 and September 2008 to December 2010) during that time frame when the stock investments were below their January 2000 value. Over the same period, real estate was up 12% per year and gold was up 14% per year.
Owning just stocks turned out to be anything but a sure thing.
Things could happen in the future to the economy, world politics, the climate, and other areas which may limit stock increases over the coming years. I am not making a market prediction here, but my point is that past performance does not guarantee future results.
To overcome the unknowns of the future, we need to spread our investments over multiple asset classes or investment types.
When you invest new money or rebalance your investments today, you should be concerned about future performance and not assume that stocks will continue to outperform.
If you have questions or concerns about your portfolio allocation, please contact me today.
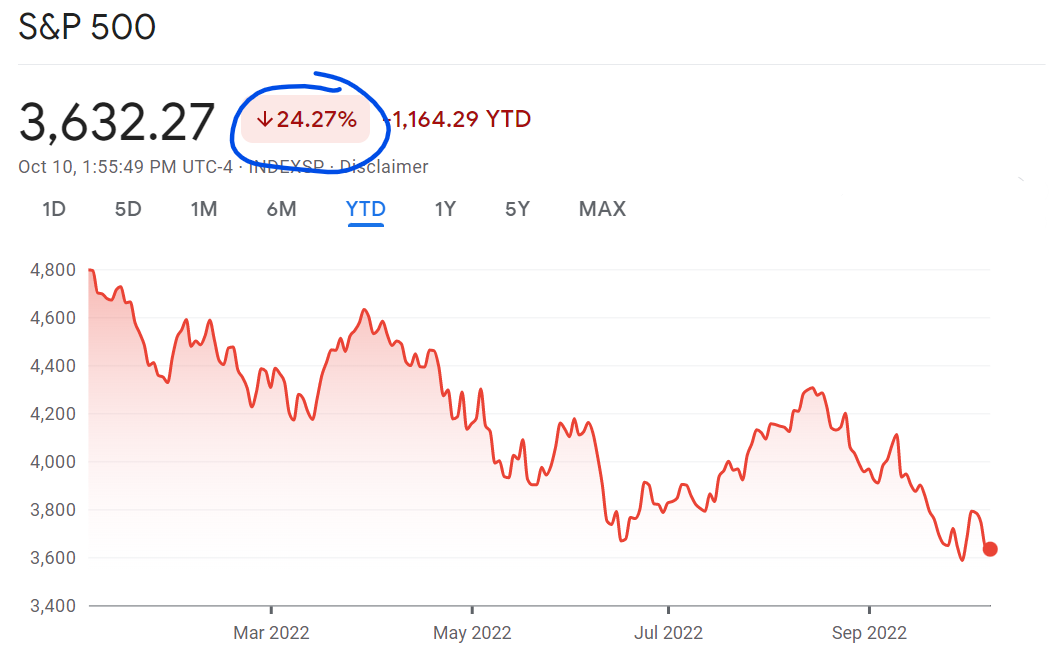
As I am sure you know, the stock market in 2022 has had a terrible year. As of October 10th, it is down 24% for the year. Could the bottom be near, and the markets go higher from here?
The Federal Reserve has been raising interest rates to fight inflation. Rising interest rates make business and personal loans more expensive which slows down the economy. With a slower economy, inflation should be lower.
In a full economic cycle, growth slows down as loans get more expensive. This slowing leads to some businesses struggling and needing to lay off workers. In the current cycle, businesses have yet to lay off workers. In fact, they are still hiring more employees.
On Friday, October 7th, the September jobs report was released, and 263,000 new jobs were created. Increasing jobs means the economy is still running well. Unemployment decreased to 3.5%.
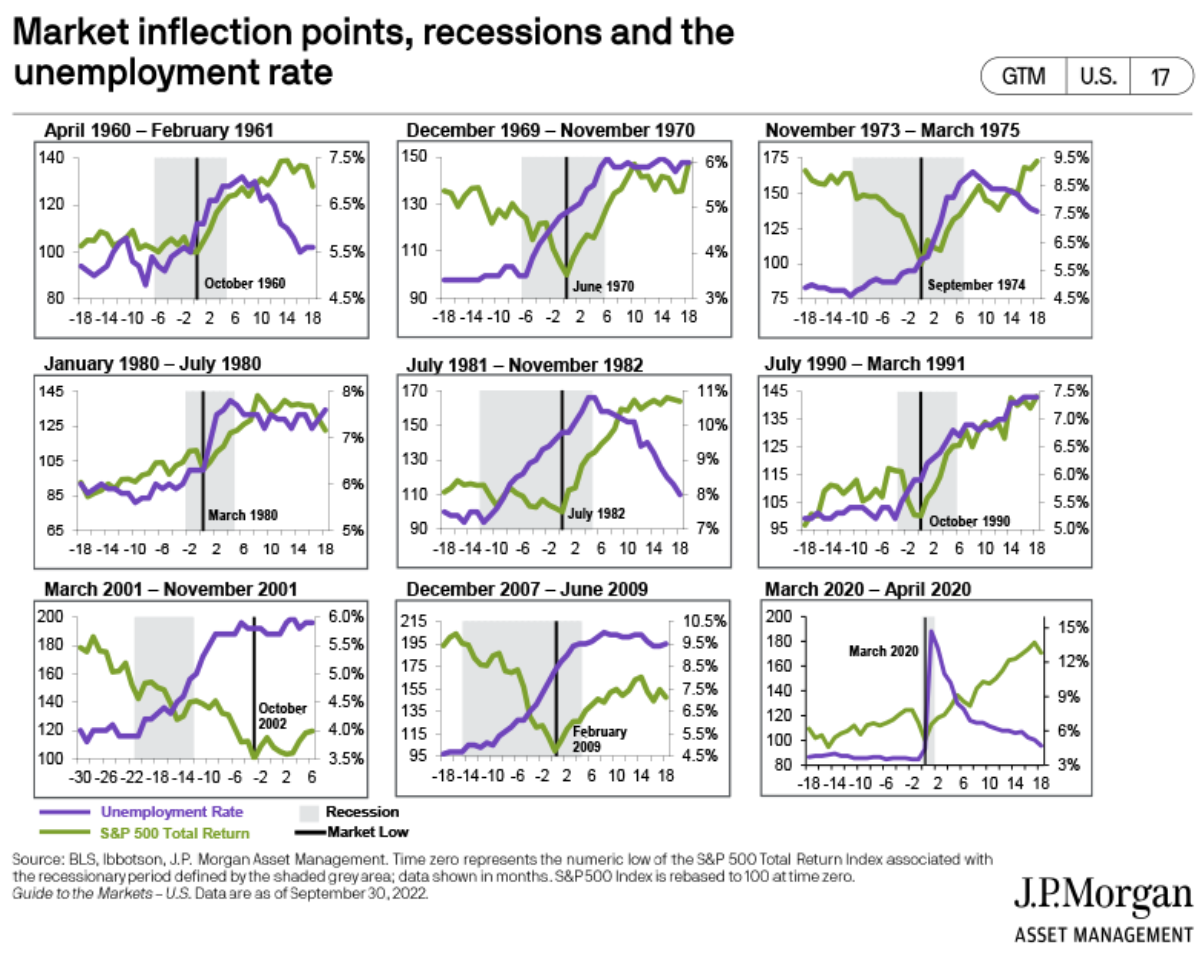
According to JP Morgan’s research in their Guide to the Markets, unemployment increases before the market hits a bottom. This can be seen in the following charts of market bottoms. The unemployment rate is the purple line, and the market bottom is the black, vertical line. In each case, the unemployment rate (purple) was increasing before the market bottomed.
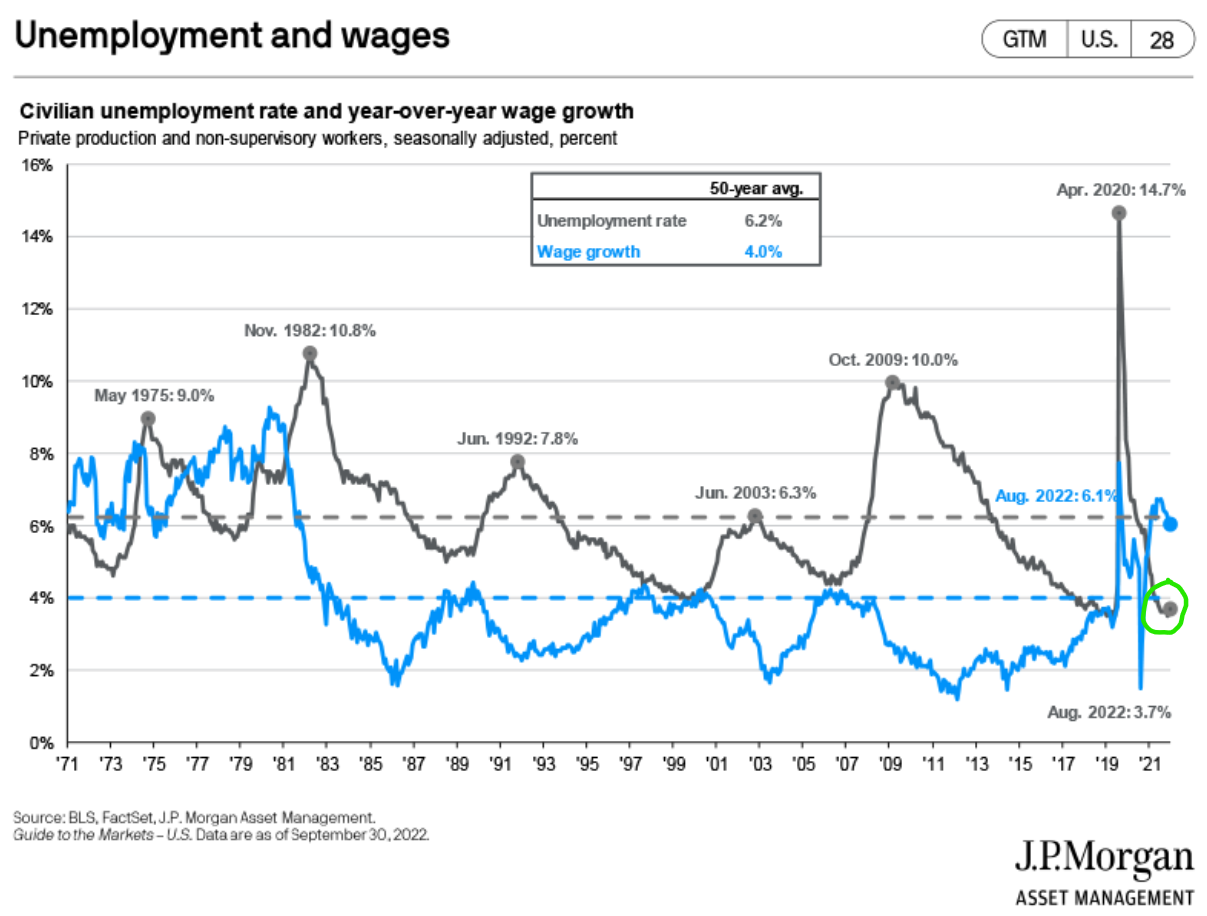
The current 3.5% unemployment rate is low and has remained low these past several months, even with the Federal Reserve quickly raising interest rates. There is no sign of increasing unemployment at the current time. The next graph shows the unemployment rate as a grey line with the current rate circled in green.
As the Federal Reserve continues raising interest rates, the economy will eventually slow, and workers will be laid off. Until that slowing happens, watching the unemployment rate should give us a hint for when the stock market is approaching its bottom.
If the unemployment signal holds during this downturn, as it did in the previous economic downturns, then we are still months away from a market bottom.
I recently spent four days at a tax training seminar for financial advisors. There were many impactful topics covered in the lessons. One of those, which I will cover in this blog post, is referred to as the widow’s (or widower’s) penalty.
When one spouse dies, the remaining spouse is allowed to file their taxes as married filing jointly (MFJ) one final time in the year of their wife’s or husband’s death. In the following years, unless they remarry, they must file their taxes as single.
This shift from married filing jointly to single can create a large tax increase, even though the widow’s / widower’s income goes down in a lot of cases. Let’s look at an example.
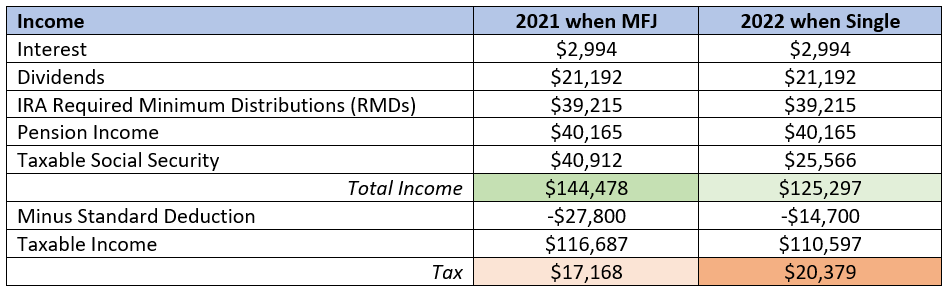
In this example, the couple were both retired and had various income streams. They had interest and dividends from their investments, required minimum distributions from their IRAs, a pension, and two Social Security benefits.
After the husband’s death, the widow’s Social Security income goes down because the survivor only gets the larger benefit, not both. In this example I held RMD and pension income constant for simplicity’s sake. In reality, the RMDs would change from year to year, but the pension income could stay the same if the pension had a 100% survivor benefit.
The following table shows the various incomes and the tax due.
You can see in this example that the widow’s income dropped $19,181 from $144,478 to $125,297. However, her taxes increased by $3,211 (from $17,168 to $20,379)! This is the widow’s penalty.
What can we do about this?
Planning for this scenario should be done many years in advance. If we look at the main sources of income, their pension income and Social Security income are out of our control. They will be what they will be. It is the IRA required minimum distributions (RMDs) that we could make an impact on, depending on the strategies we implement and their timing.
Large IRAs are a good thing to have, but they can create tax issues if they are not withdrawn from in a smart manner. It all depends on your particular circumstances and numbers, but perhaps using the IRA money to live on when you first retire, before RMDs begin would help to minimize these taxes. Or perhaps an aggressive Roth conversion strategy early in retirement would be the best option for you. There are no hard and fast rules, it all depends on how the numbers work out.
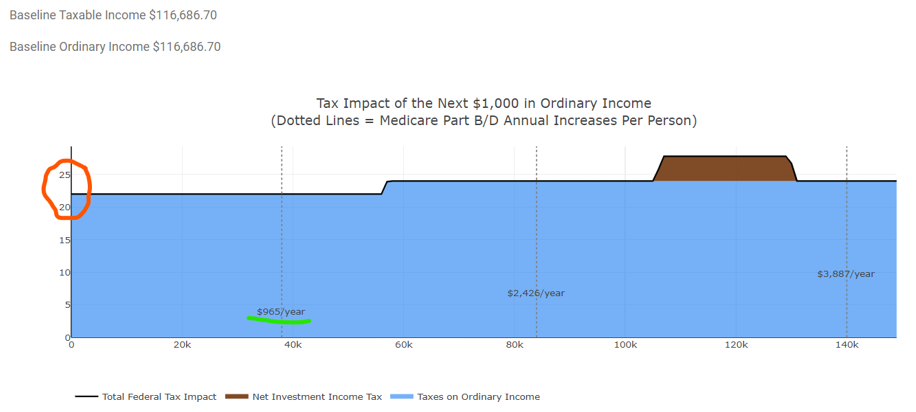
Medicare Impact
The next two diagrams bring up another important consequence of not optimizing your withdrawal strategy. These diagrams show the tax implications of each additional $1,000 of taxable income. In the top one, the married couple has about $38,000 of additional income they can handle before their Medicare premiums are bumped up due to passing an income limit. The increased Medicare expense is shown as the dashed, vertical lines.
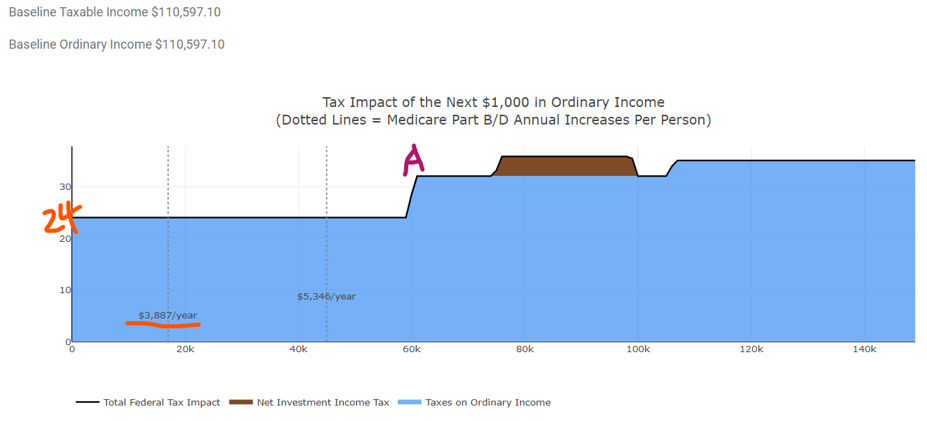
In the single widow’s graph, the second one, she only has about $17,000 of additional income available before her income pushes up her Medicare premiums.
The issue is not just that the widow will reach the Medicare expense threshold sooner, it’s that the increase will be far more significant than the couple who are both still alive. The widow would have to pay $3,887/year more for Medicare versus $965/year more for the couple.
If her IRA investment value stays about the same size or increases, her RMDs will be increasing each year, and she will likely hit this Medicare barrier, increasing her annual expenses by $3,887/year.
You can also see that in the second diagram showing the widow’s taxes, she could reach the 32% Federal tax bracket with $61,000 of additional income (point “A” on diagram). Whereas the 32% bracket does not show for the MFJ couple, even with an additional $150,000 of income.
Having a plan in place to manage the widow’s penalty tax issue, and other issues that are out there, could save you or your spouse a large amount of money. If you are interested in discussing your withdrawal plan, please use this link to set up an appointment.
If you follow financial news, you will have seen reports about the Federal Reserve’s new inflation target. Rather than using their goal of a 2% cap on inflation, the Federal Reserve would like to see inflation average 2% over an extended period of time.
This sounds like a subtle change, but it may have big repercussions.
Why does the Fed want a higher rate of inflation?
A continual low level of inflation is desired. When [consumer] prices are going up, people want to buy now rather than pay more later. This increases demand in the short term. As a result, stores sell more and factories produce more now. They are more likely to hire new workers to meet demand. It creates a virtuous cycle, boosting economic growth. [Source]
This boost to the economy is what the Fed is trying to create. A little boost would help get us out of the coronavirus slump. If the boost is allowed to continue uncapped, however, things could get out of control.
I believe that by removing their 2% cap on inflation, the Federal Reserve is returning to the Alan Greenspan years. With Mr. Greenspan as Chair, the Federal Reserve did not preemptively raise interest rates to keep a lid on the economy. They raised rates too late.
Throughout the 1990’s the economy grew until peaking with the Dot com bubble bursting in 2000. Then in 2007 we had the housing bubble. In both instances, the Federal Reserve did not raise interest rates quickly enough to keep inflation in check.
It was after these two bubbles that the Federal Reserve switched to the idea of capping inflation in January of 2012. Now they are going back again.
I reason that if the Federal Reserve goes back to its previous policy, then we should expect the same results. I think we will again see bubbles, and most likely, they will be in the same places as last time.
One could argue the stock market is already approaching a bubble in tech and other popular stocks like Tesla. Since the Coronavirus-19 lockdown many people have felt that tech stocks are a can’t lose investment and have been continually buying. The tech company Snowflake became the largest IPO ever, but it doesn’t make a profit. Sounds a bit like 1999.
There is a reason that tech stocks and real estate were the two places for bubbles last time and possibly next time. With low interest rates like we have now, there is no income reward for owning bonds. Earning 0.85% per year on a 10-year Treasury bond is not a worthwhile investment for a lot of people. Therefore, they move their money where they will get returns. That means stocks and real estate.
If the Federal Reserve delays raising rates, there is going to be easy money around for several years. Where will that easy money go? Into business investment (stocks) and into real estate.
As investors we need to stay with the investments that are going to attract cheap money and benefit from low interest rates. That means continue to own your stocks and buy real estate (REITs or individual properties) if you don’t own some already.
Federal employees, State employees, teachers, union workers, and others who have most of their net worth in their pension, their work retirement account (TSP, 403(b), 457, etc.), and their home equity are a perfect fit for the consultant financial planning service offered by Andrew Marshall Financial, LLC.
Conflict free
Fee only consultant style advice, rather than assets under management (AUM) fees, aligns us with pension employees. By not requiring you move your investments, a major conflict of interest is removed and therefore, we are free to give you the most open advice possible.
Decisions such as paying off your mortgage early or leaving your investments in the TSP/ 403(b)/ 457 may be the best for you. An advisor getting paid based on your account size has a motivation to not recommend those moves.
When Andrew Marshall Financial, LLC gives advice, it is in your best interest, not ours. We are a fiduciary, and we take that seriously.
No ongoing fees
Another issue with assets under management financial advisors is they charge ongoing fees, even if they aren’t giving you financial advice. With our financial planning, you pay only for what you need, when you need it.
As you approach retirement, adjusting your course once per year is usually a good idea. Once you start your pension, you may not need ongoing advice. More likely, you will settle into your retirement lifestyle and new routine. You may only need or want financial advice every two or three years. With Andrew Marshall Financial, LLC, you only pay for advice when you need it.